Fig. S3.
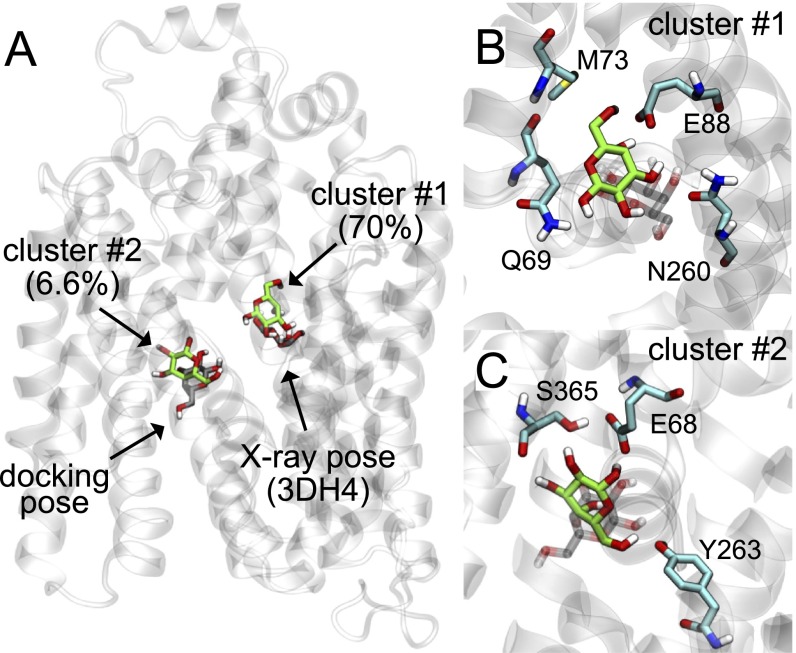
Clustering analysis of galactose molecules from sugar release simulations. (A) The vSGLT structure (PDB ID code 3DH4) with resolved galactose (gray molecule on Right) and the generator for the most populated cluster (green), which contains 70% of the data. The Schrŏdinger Glide XP software package (44) was used to dock (rigid receptor/flexible ligand) a second galactose molecule into the intracellular cavity resulting in the pose on the Left (gray). This pose occupies the second most populated cluster (6.6% of the data) with the cluster generator shown in green. Clustering was carried out using MSMBuilder3 in concert with MDTraj (41). The K-centers algorithm was used with a square Euclidean metric and 500 clusters. (B) Magnified image of the top cluster generator (green) and resolved galactose molecule from the 3DH4 structure (gray). (C) Magnified image of the second most populated cluster generator (green) with docked pose (gray). The docked pose and cluster generator contain three of the residues identified by Li et al. in their recent work (11).

