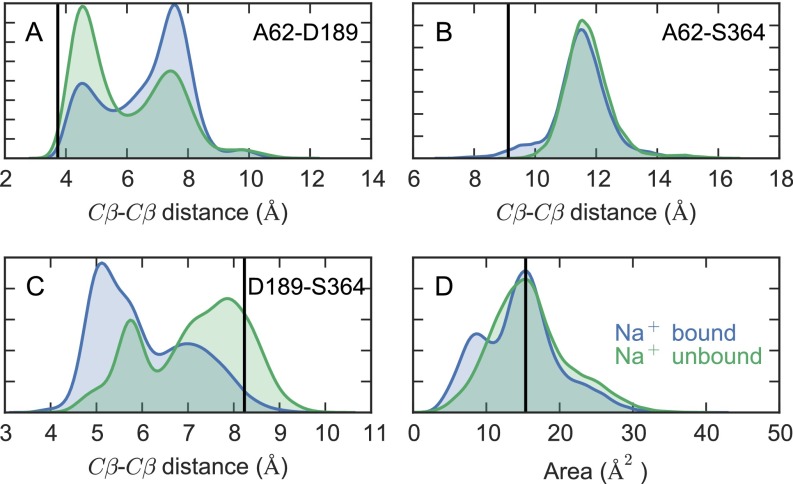
Fig. S4.
Residue–residue distance distributions in the Na2 site. Distributions of the Cβ–Cβ distances between (A) A62 and D189, (B) A62 and S364, and (C) D189 and S364, in the presence and absence of Na+ in the Na2 site. (D) The area of the triangle formed by the three residues. The black vertical line in each panel is the value observed in the 3DH4 X-ray structure.

