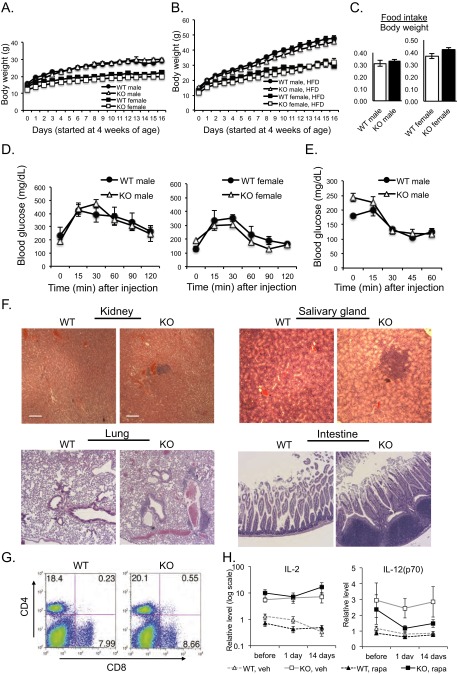
Fig. S1.
Phenotypes of Pip4k2c−/− mice. (A and B) The growth curves of wild-type and Pip4k2c−/− mice. Mice (started at the age of 4 wk) were weighed weekly for 16 wk. (A) Mice placed on a normal diet. n > 9 per group. (B) Mice placed on a high-fat diet. n > 13 per group. The results are presented as means ± SE of the means. (C) Food intake of wild-type and Pip4k2c−/− mice. The food intake was measured by housing one or two mice of the same genotype per cage and weighing the food in the cages every morning at 11:00 AM every 3 d for 2 wk. The amount of food consumed was divided by the average body weight of the mice in each cage. n = 5 per group. The results are presented as means ± SE of the means. (D) Glucose tolerance test of wild-type and Pip4k2c−/− mice. After weaning, the 4-wk-old mice were placed on a high-fat diet for 5 mo. The mice were i.p. injected with 1 mg of glucose per gram of body weight from a 20 mg/mL solution of glucose in 0.9% NaCl. Blood glucose levels were measured with a One Touch Basic glucose meter before injection of glucose and at indicated time points. n > 5 per group. The results are presented as means ± SE of the means. (E) Insulin tolerance test of wild-type and Pip4k2c−/− mice. The mice were starved from 9:00 AM to 1:00 PM and at 1 PM, the mice were i.p. injected with Novolin-R at a dose of 0.5 units/kg of body weight. Blood glucose levels were measured with a One Touch Basic glucose meter before injection of glucose and at indicated time points, three WT mice and six KO mice (6 mo old). The results are presented as means ± SE of the means. (F) Immune cell infiltration in the kidney, salivary gland, lungs, and intestine of Pip4k2c−/− mice. H&E staining readily identifies immune infiltrates in the indicated tissue of 12- to 14-mo-old Pip4k2c−/− mice. (Scale bars, 100 μm.) (G) Flow cytometry of CD4+ and CD8+ T cells isolated from spleens of wild-type versus Pip4k2c−/− mice. The most representative data from three independent experiments are given, with n > 3 mice (12–14 mo old) from each group. (H) Effects of rapamycin treatment of wild-type mice or Pip4k2c−/− mice on plasma IL-2 and IL-12(p70) levels. Plasma cytokines were detected using multiplex cytokine ELISA. Plasma was collected before the treatment (“before”), 24 h after the first treatment (“1 day”), and a day after the final treatment (“14 day”) from the following four groups: wild type with vehicle, wild type with rapamycin (3 mg⋅kg−1⋅d−1), knockout with vehicle, and knockout with rapamycin (3 mg⋅kg−1⋅d−1), approximately four to eight mice (12–14 mo old) per group, daily i.p. injections for 2 wk. Data were normalized to the mean plasma level of IL-2 and IL-12(p70) in wild-type mice before therapy with 1 on the y axis indicating the mean of wild-type pretreatment (WT, vehicle, before): IL-2: 11.2115 RLU, IL-12(p70): 24.359 RLU. The results are presented as means ± SE of the means.

