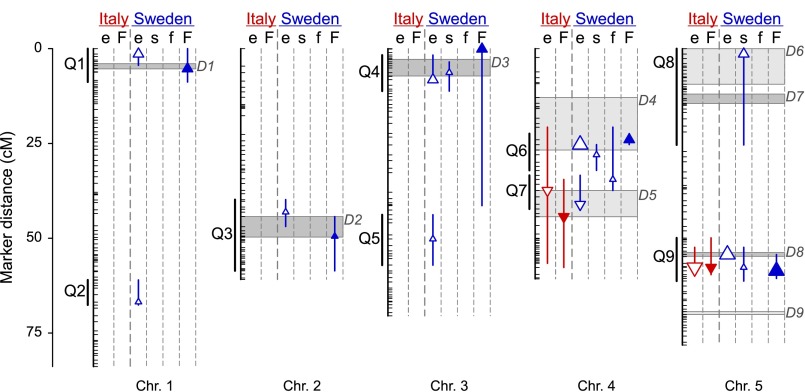
Fig. 3.
QTL identified for total fitness (F; closed symbols) and its components establishment (e), survival (s), and fecundity (f) (open symbols) in Italy (red) and Sweden (blue). The triangle (with vertical line) shows the point estimate (with 95% Bayesian credible interval) of the QTL position. The orientation of the triangle indicates the effect of the Swedish genotype (upward, higher phenotype value; downward, lower phenotype value), and the size of the triangle represents the proportion of phenotypic variance among RILs explained by the QTL (small, ≤5%; medium, 5–10%; large, ≥10%). The black vertical lines specify the locations of the distinct QTL identified for total fitness and the fitness components (Q1–Q9; Methods). The boxes present the 95% Bayesian credible intervals for dormancy QTL (D1–D9) identified in one maternal environment (light gray) and the range of point estimates for dormancy QTL detected in more than one maternal environment (dark gray) in a previous study of the same RIL population (38).

