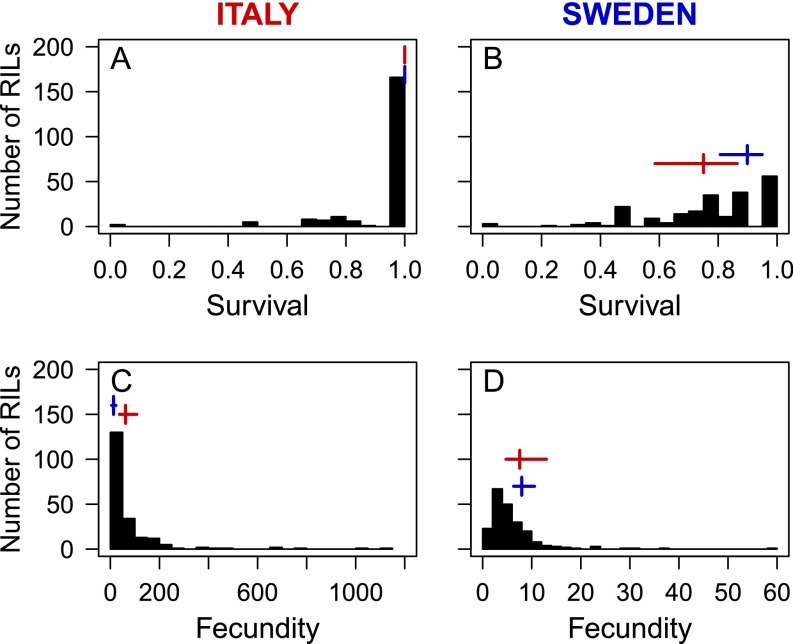
Fig. S1.
Frequency distributions of mean survival and fecundity of 209 RILs in Italy (A and C) and 219 RILs in Sweden (B and D). The vertical and horizontal lines show the mean survival and fecundity values of the Italian (red) and Swedish (blue) genotype with corresponding 95% confidence intervals. Note the difference in the scale of the x axis for fecundity in C and D.

