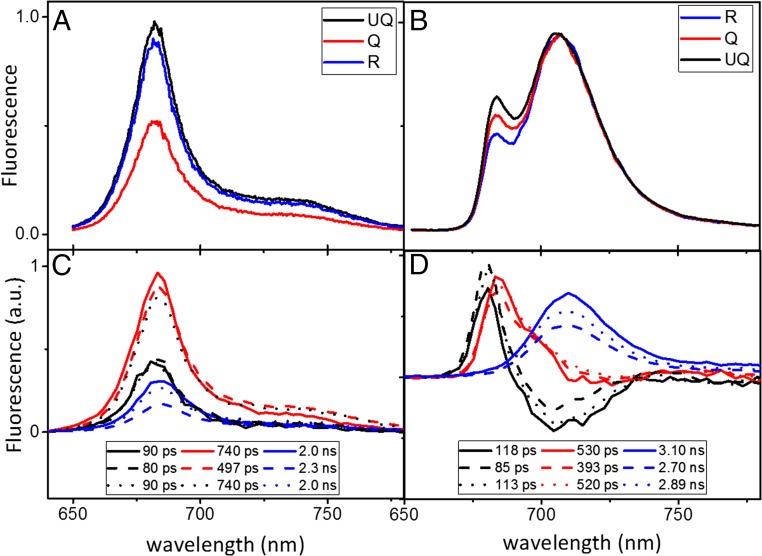
Fig. 5.
Steady-state and time-resolved fluorescence spectra of LHCII+LHCSR1 cells. (A) Steady-state fluorescence at room temperature (B) and at 77 K. (C) Time-resolved fluorescence at room temperature and (D) at 77 K. For the time-resolved data, DAS, estimated from global analysis, are shown and the corresponding lifetimes are indicated. The excitation wavelength was 475 nm for all experiments. Fluorescence spectra of UQ, Q, and R were induced and measured on the same cells at room temperature, but on different cells at 77 K. The 77 K spectra under different conditions were normalized to their respective maximum in B and to their time 0 emissions in D; see streak images in Fig. S5.

