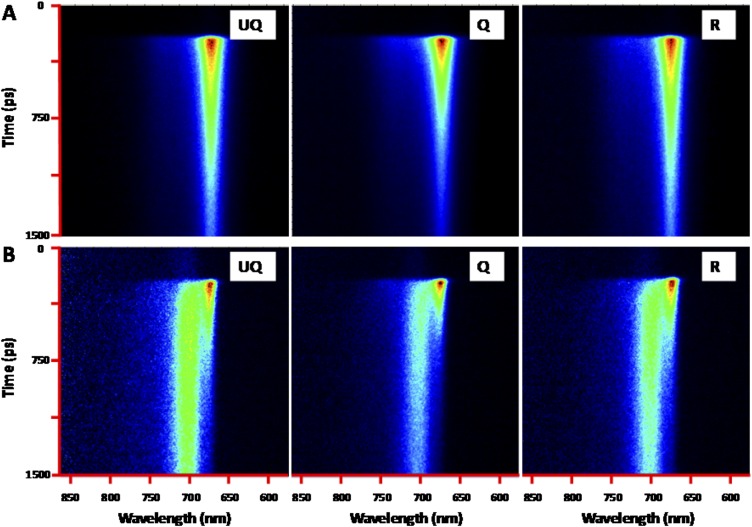
Fig. S5.
Streak-camera images of LHCII+LHCSR cells. (A) at RT (B) at 77 K. Three states, UQ, Q, and R, were recorded at each temperature. The images show the fluorescence intensity (in linear color gradient) over time (vertical axis, ∼1.5 ns in total) and over wavelength (horizontal axis, from 590 to 860 nm).

