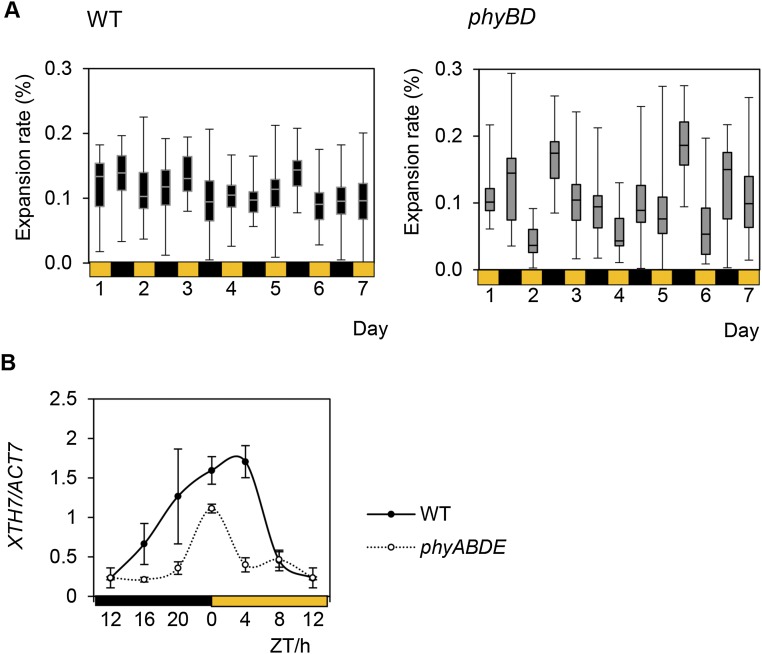
Fig. S3.
Growth assay of WT and phytochrome mutants. (A) Relative day and night rosette leaf expansion pattern of whole rosette in Ler WT and phyBD. Rosette area was quantified at dawn or dusk (in a 12-L:12-D cycle). The expansion rate for day vs. night was calculated by setting the starting area at dawn to 100, subtracting the area at dusk, and expressing the value as a percentage of the starting point. The box-and-whisker plot shows the minimum, first quartile, median, third quartile, and maximum of a set of data. (B) Diurnal expression profile of XTH7, determined by qRT-PCR, in 5-wk-old WT and phyABDE plants. Values are presented as mean ± SEM.

