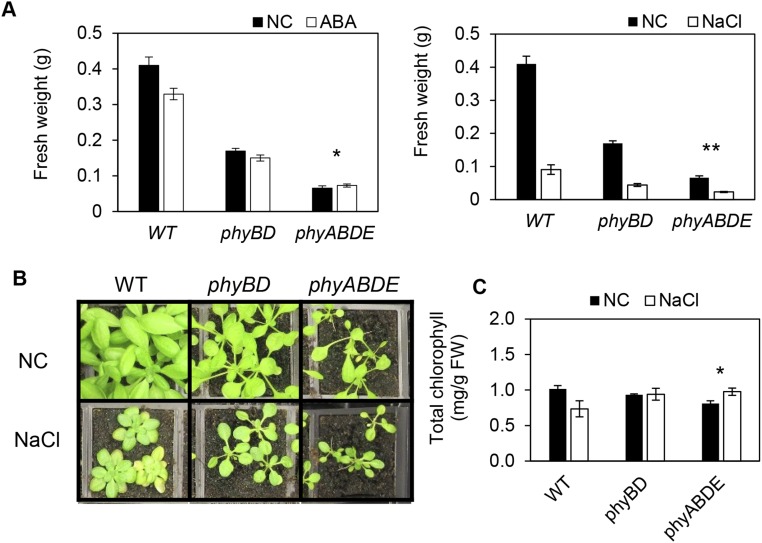
Fig. S6.
Abiotic stress responses in adult plants. (A) Quantification of ABA and NaCl stress repression of biomass in adult plants. Here 4-wk-old plants were watered once with 100 μM ABA or 350 mM NaCl, after which normal watering resumed. Plant tissue was harvested 2 wk later. (B) WT and phytochrome mutant plants at 2 wk after NaCl application. (C) Chlorophyll levels in plants exposed to the NaCl stress test (as in A and B). Values are presented as mean ± SEM. Asterisks indicate significant differences in the response to ABA/salt treatment for each genotype compared with the control, as assessed by two-way ANOVA (FW data log-transformed for analysis). *P ≤ 0.05, **P ≤ 0.01.

