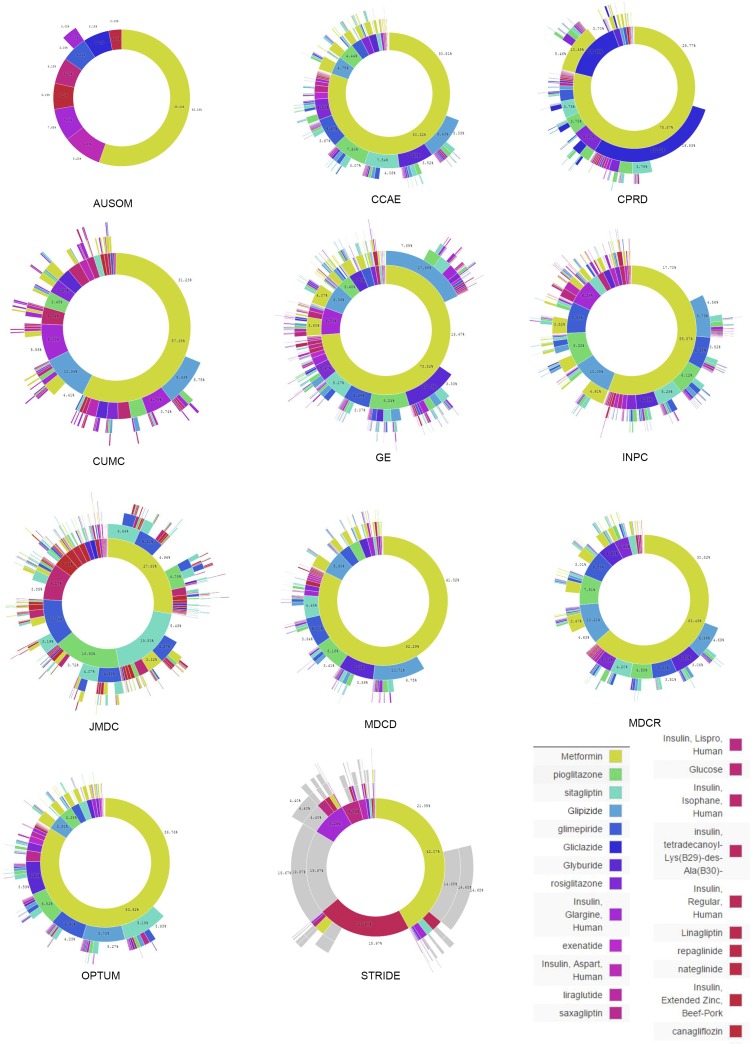
Fig. S1.
Treatment pathways for type 2 diabetes mellitus. The inner circle for each source shows the first relevant medication that the patient took, the second circle shows the second medication, and so forth. The data source abbreviations are defined in Table 2.

