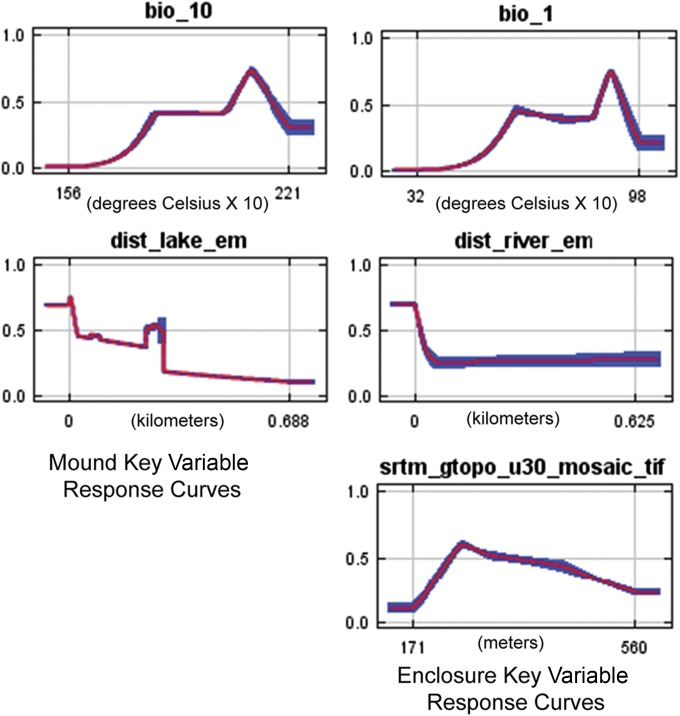
Fig. 3.
Response curves of key variables for mounds and enclosures (all variable curves are in SI Text). These curves were created using each input variable alone for the MaxEnt model for mounds and enclosures, which shows the dependence of predicted suitability as it patterns with the selected variable. The curves show the mean responses of the replicate MaxEnt runs (red) and ±1 SD (blue).

