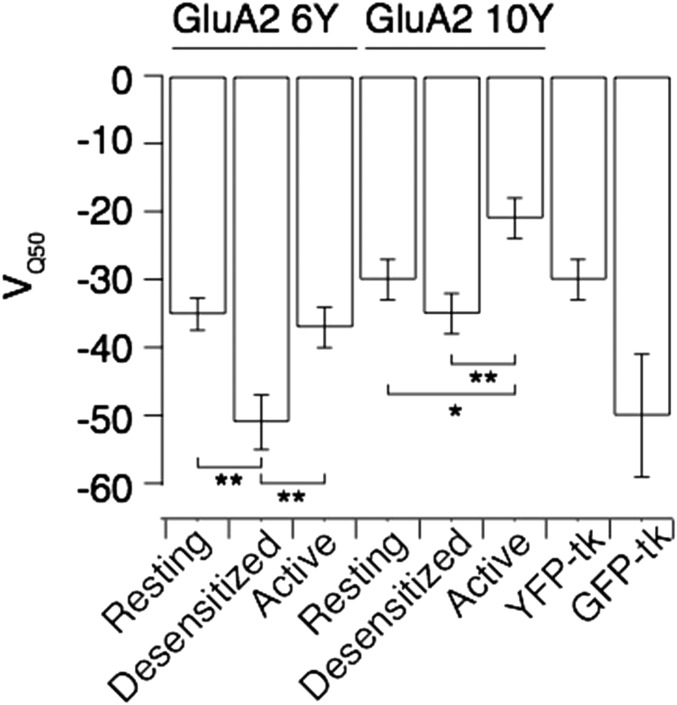
Fig. S5.
Summary of half-maximal quenching voltages. Cells expressing GluA2-6Y, GluA2-10Y, or membrane-tethered GFP or YFP were exposed to 5 μM DPA, and the membrane potential was ramped from −120 mV to +120 mV. For the GluA2 fusions, recordings were made in different functional states, as in shown in Fig. 5 A and B. The values for VQ50 were obtained by fitting a sigmoid function to the curves in Fig. 5D. For GluA2-6Y: VQ50 rest = −35.1 ± 2.4 mV, n = 29; VQ50 des= −51 ± 4 mV, n = 29; and VQ50 act = −37 ± 3 mV, n = 23. For GluA2-10Y: VQ50 rest = −30 ± 3 mV, n = 12; VQ50 des = −35 ± 3 mV, n = 12; and VQ50 act = −21 ± 3 mV, n = 10. An unpaired two-tailed Student’s t test gave P = 7.25E-04 (6Y VQ50 rest vs. VQ50 des), P = 6.09E-03 (6Y VQ50 des vs. VQ50 act), P = 0.004 (10Y VQ50 des vs. VQ50 act), and P = 0.03 (10Y VQ50 rest vs. VQ50 act). Membrane-tethered GFP or YFP had the following values: VQ50 YFP-tk = −29 ± 3 mV and VQ50 GFP-tk = −50 ± 9 mV. *P < 0.05; **P < 0.01. tk, truncated k-Ras sequence.

