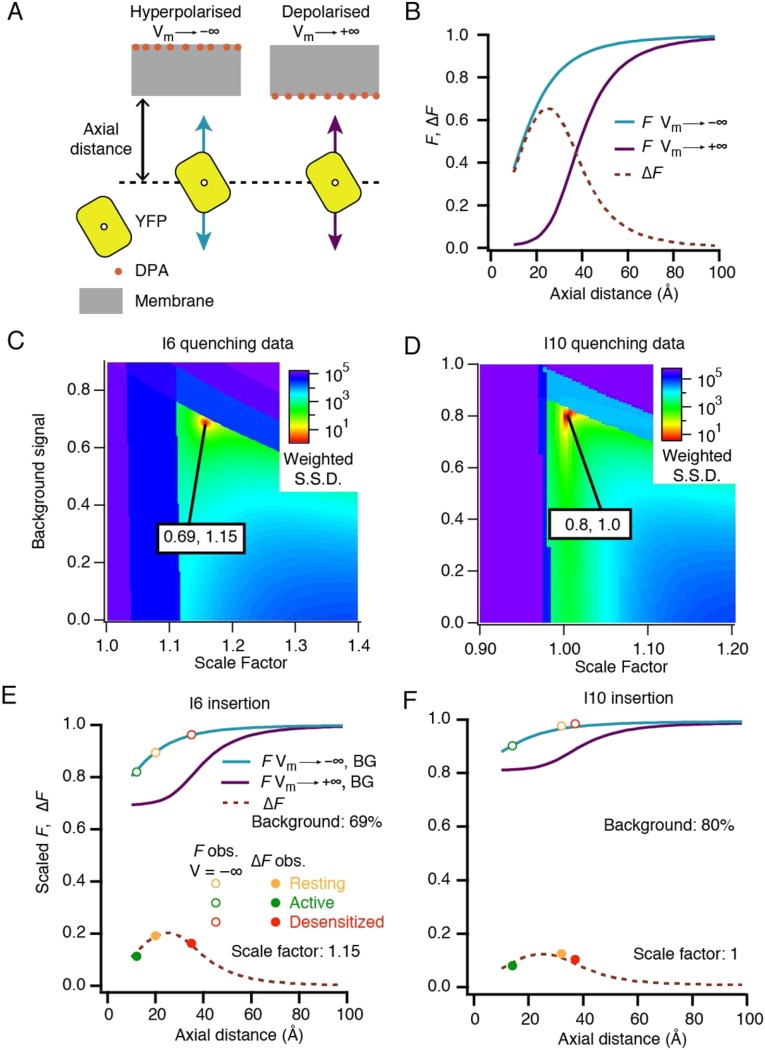
Fig. S6.
Determination of axial positions of the I6 and I10 fluorophores relative to the cell membrane. (A) Cartoon of the geometry of YFP inserts against mobile DPA in the plasma membrane. (B) Quenching saturates in the depolarized condition but not in the hyperpolarized condition, due to the thickness of the membrane and the size of YFP. This effect produces a hump in the ∆F curve (the maximum difference between fluorescence at positive and negative extremes of voltage). (C and D) Absolute scale of the experimental fluorescence measurements is unknown, as is the fraction of signal that comes from background fluorophores that are not at the plasma membrane. By comparing the experimental values for each insert across the three states (arbitrarily scaled) to the curves in B with arbitrary background applied, a good fit is found at 0.69, 1.15 for I6 (C) and 0.8, 1 for I10l (D). S.S.D., summed square deviation. A penalty was applied if the points could not physically lie on the curve, creating the dark-blue “forbidden” areas. (E and F) Plotting the best-fitting descriptions allows us to read off the axial positions of I6 (resting, 20 Å; active, 12 Å; and desensitized, 35 Å) and I10 (resting, 32 Å; active, 14 Å; and desensitized, 37 Å).

