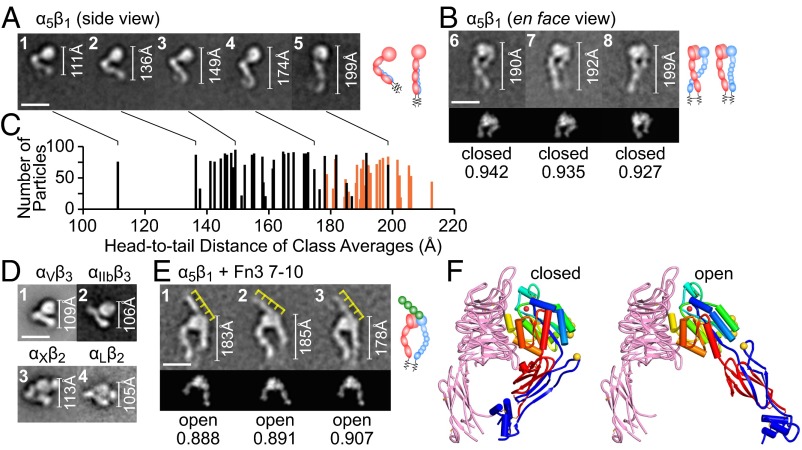
Fig. 2.
Integrin α5β1 alone and in complex with Fn3 7–10. (Scale bars, 10 nm.) (Right) Interpretative cartoons show α5, β1, and Fn3 7–10 in red, blue, and green, respectively. Headpiece portions of en face views were cross-correlated with 2D projections of closed and open headpiece crystal structures; the best-correlating projection and its correlation coefficient are shown below each class average. White rules show the total distance from head to tail; yellow rules interpret the four Fn3 domains in Fn3 7–10. (A and B) α5β1 class averages; the classes represented in A are marked in C by connecting lines. (C) All α5β1 class averages showing head-to-tail distance and particles per class, with side views in black and en face views in orange. (D) Class averages of αVβ3, αIIbβ3, αXβ2, and αLβ2 in their bent conformation (4, 7, 8). (E) α5β1–Fn3 7–10 complex. (F) Closed and open headpiece crystal structures (1, 25) rendered as described in Fig. 8.

