Fig. S4.
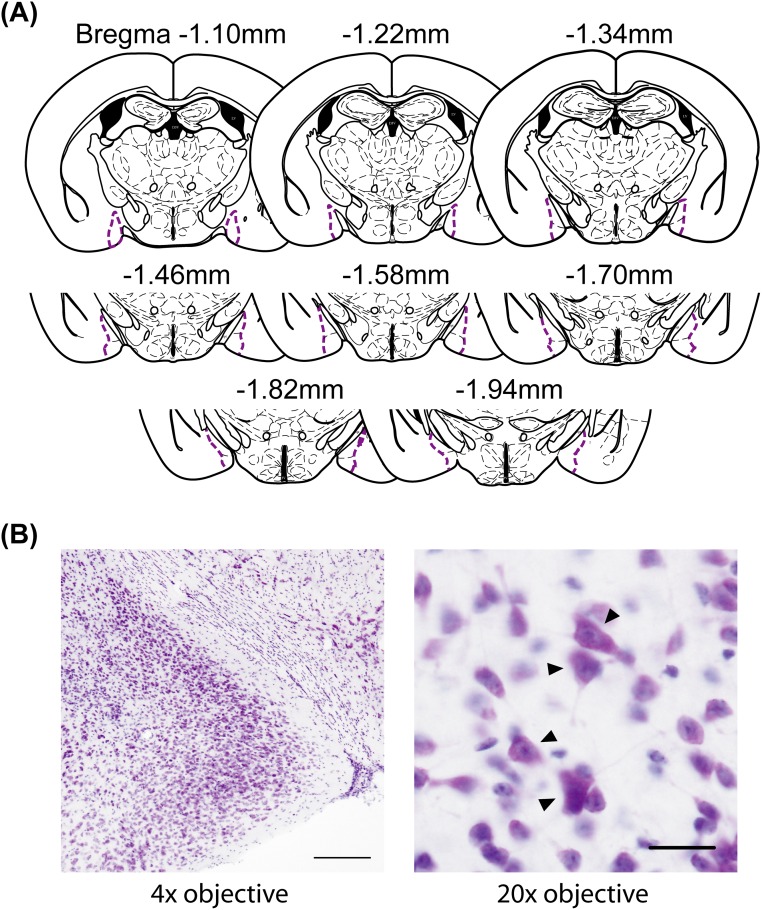
(A) Histological diagrams of the MeA included in the morphological evaluation. (B) Representative photomicrographs of a Nissl-stained MeA section viewed under 4× objective (Left) and the same section viewed under 20× objective (Right). (Scale bars: Left, 200 µm; Right, 20 µm.) The black arrowheads indicate neuronal cells.

