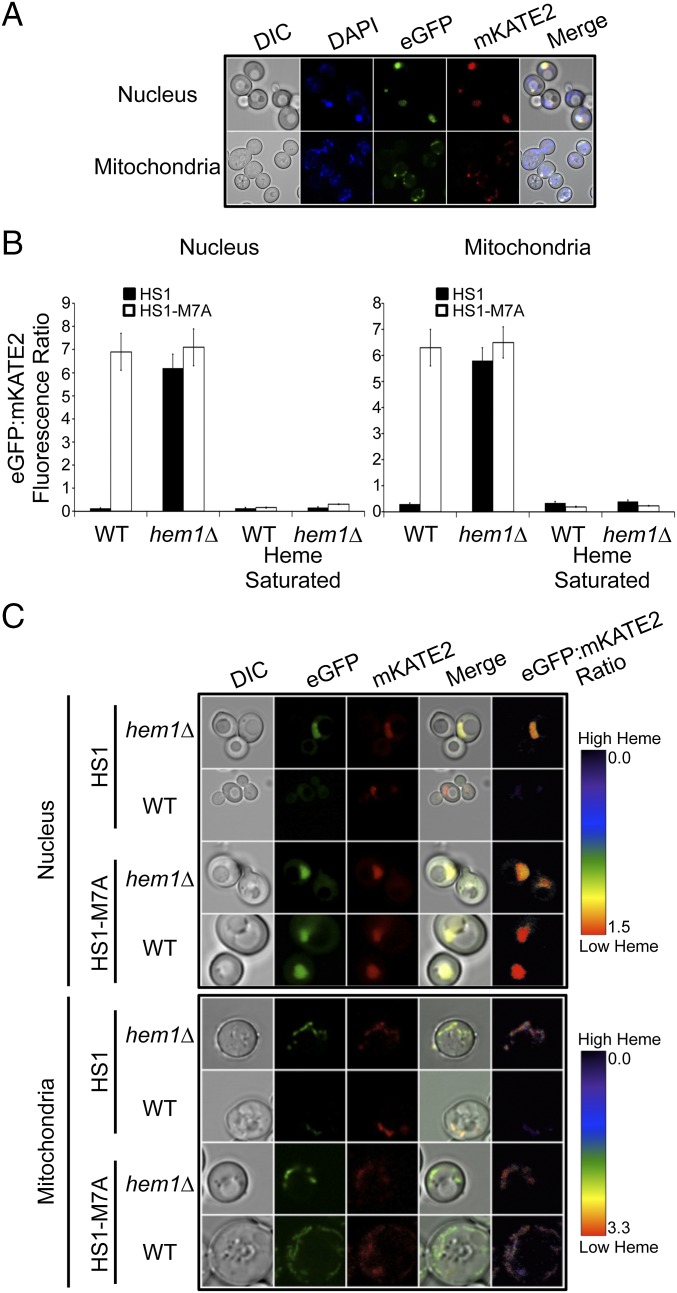
Fig. 3.
Nuclear and mitochondrial heme monitoring with HS1 and HS1-M7A. (A) To label DNA, hem1∆ cells expressing nuclear or mitochondrial targeted HS1-M7A were stained with DAPI. Live cells were imaged as described in Materials and Methods at a magnification of 63×. “Merge” is the merged images of DAPI, EGFP, and mKATE2. (B) Heme-dependent EGFP/mKATE2 fluorescence ratios of nuclear and mitochondrial targeted HS1 and HS1-M7A in WT and hem1∆ yeast cells as measured by fluorimetry. “Heme-saturated” is the ratio recorded upon Triton X-100 permeabilization of yeast spheroplasts and incubation with excess heme as described in the main text for in situ calibration for the mitochondrial and nuclear sensors. (C) Confocal microscopy of WT and hem1∆ cells expressing nuclear and mitochondrial targeted HS1 and HS1-M7A. Fluorimetry data represent the mean ± SD of triplicate mid-log-phase cultures grown in SCE-LEU. Microscopy images are representative of at least two independent cultures. DIC, differential interference contrast.

