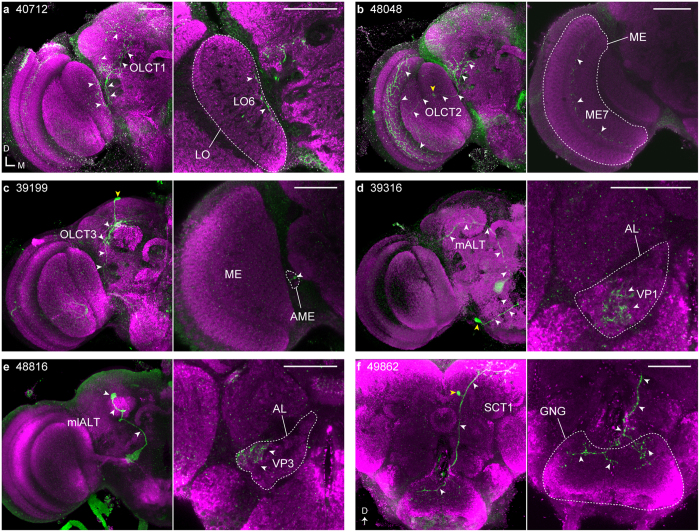
Figure 2. Single cell morphologies of the neurons which connect between the primary sensory centers and MB accessory calyx revealed by FLP-out experiments.
Strain number of the Janelia Farm GAL4 line is shown top left in the left panel. Magenta shows the anti-SYNAPSIN antibody signals. Left panel: Single neuron (green) labeled with the GAL4 strain by the FLP-out experiment. The cell body and trajectory of the neural fiber from the primary sensory center to the calyx are indicated by yellow and white arrowheads, respectively. Right panel: Arborizations in the primary sensory center shown by arrowheads. (a,b,d and e) are single confocal images. AME, accessory medulla; GNG, gnathal ganglia; LO, lobula; ME, medulla; mlALT, mediolateral antennal lobe tract; OLCT, optic lobe calycal tract; SCT, subesophageal calycal tract. Genotype: Hs-flp;UAS > CD2, y+ >CD8::GFP;GAL4. Scale bars = 50 μm.

