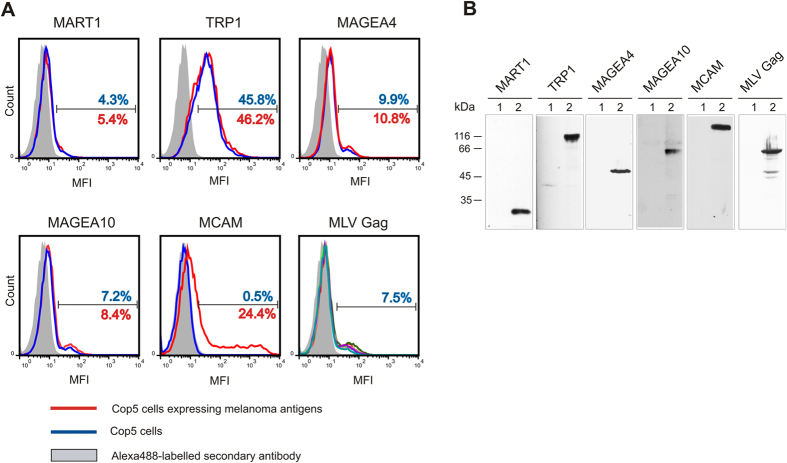
Figure 4. Cell surface expression of melanoma antigens transiently expressed in COP5 cells.
(A) FACS analysis was performed with immunostained living cells transfected with plasmids encoding for cancer melanoma antigens MART1, TRP1, MCAM, MAGEA4 and MAGEA10, and MLV Gag. The red line corresponds to cells expressing recombinant melanoma antigens, the blue line to cells without cancer antigen, and grey area shows the signal obtained with secondary Alexa488-labelled antibody. The percentage of gated cells is shown (blue for cells without cancer antigen and red for cells expressing recombinant melanoma antigens) on the image. The image of MLV Gag contains the data of five transfections obtained with electroporation with five different melanoma antigens. In all cases, one representative experiment out of the two performed is shown. MFI = Mean fluorescence intensity. (B) Western blot analysis of COP5 cells expressing melanoma antigens. Lane 1, mock control; lane 2, transfected cells.

