
Figure 3.
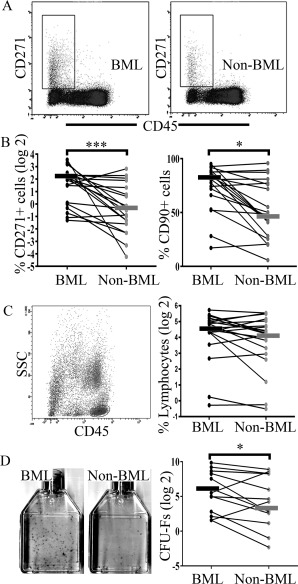
Mesenchymal stromal cell (MSC) enumeration in fractions of cells released from bone marrow lesion (BML) and non‐BML regions, following collagenase treatment. A, Representative flow cytometry plots for CD45−CD271+ MSC populations showing a rectangular selection for MSC enumeration. B, Paired‐sample line graphs showing CD45−CD271+ MSCs as a percentage of total live cells (left) and CD90+ cells as a percentage of CD45−CD271+ cells (right) in BML versus non‐BML cell fractions (n = 20 each). C, Left, Dot plots from a BML sample with gating on the CD45+ lymphocyte population. Right, Paired‐sample line graphs showing lymphocytes as a percentage of total live cells in BML versus non‐BML cell fractions (n = 20 each). D, Colony‐forming unit–fibroblast (CFU‐F) assay. Left, Representative 25‐cm2 flasks. Right, Paired‐sample line graph showing the number of CFU‐Fs per 106 plated cells in BML and non‐BML regions (n = 14 each). In all line graphs, bars show the median. ∗ = P < 0.05; ∗∗∗ = P < 0.001.