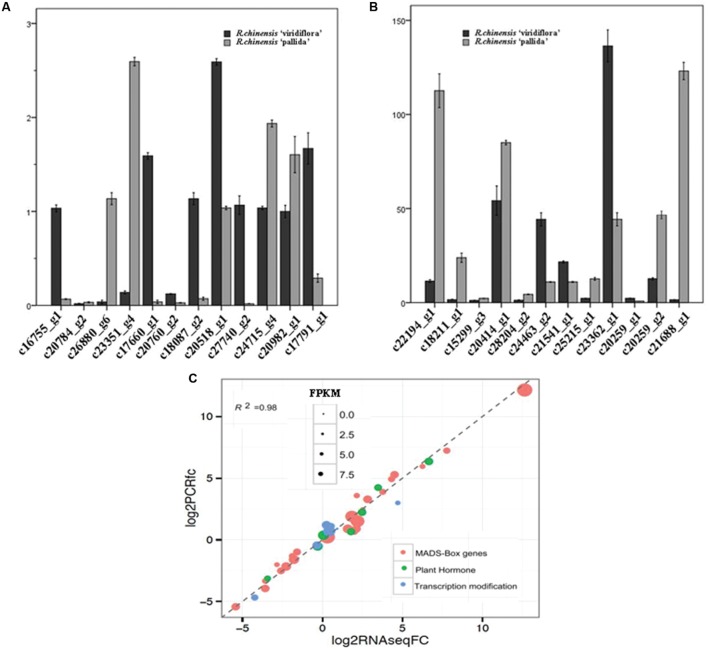
FIGURE 4.
Expression analyses of selected genes. (A,B) Real time quantitative RT-PCR (qPCR) expression analyses of transcripts selected in silico. (C) Correlation of qPCR (Y axis) and RNA-Seq (X axis) data for selected genes (involved in flowering and flower organs initiation and development) that exhibited differential expression between in R. chinensis cv. Viridiflora with Old Blush.

