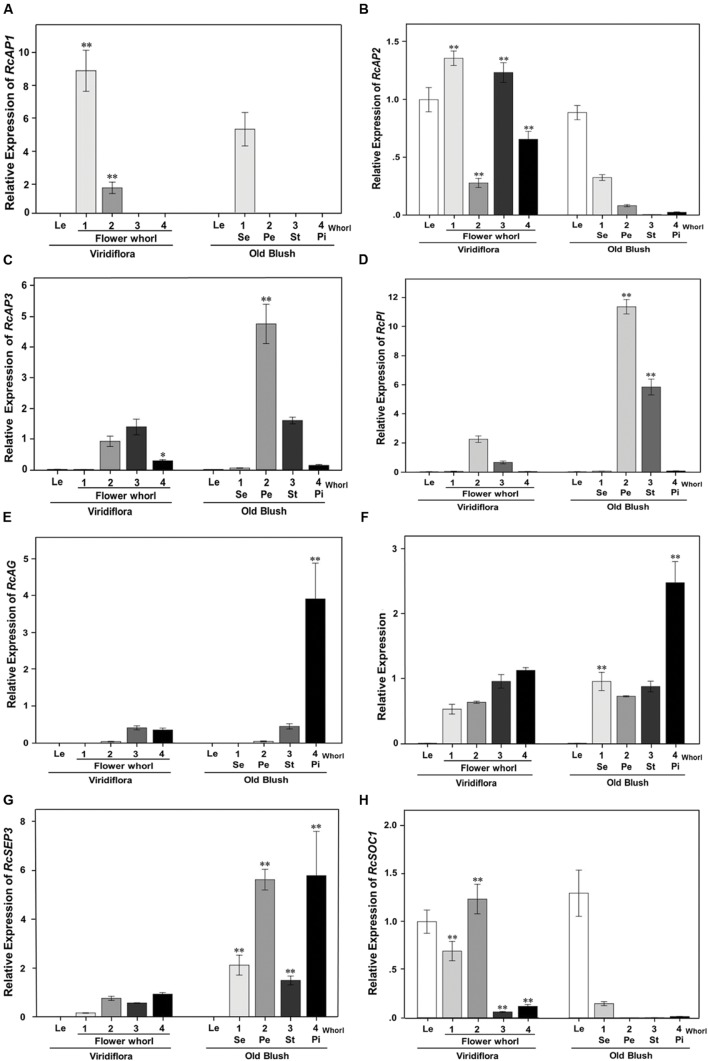
FIGURE 6.
Quantitative RT-PCR expression analyses of genes involved in flowering and in flower organ identity determination and development. Expression of RcAP1(c16755_g1; A), RcAP2 (c27740_g2; B), RcAP3 (RC000216; C), RcPI (c20259_g2; D), RcAG (c18211_g1; E), RcSEP1(RC001958; F), RcSEP3 (RC000799; G), and RcSOC1(c24463_g2; H) was analyzed in developing flower buds, at stage 8–10 mm, of Viridiflora and Old Blush. Le, leaves; 1–4, Flower whorls; Se, sepals; Pe, petal; St, stamens; Pi, pistils. Values are mean ± standard deviation (n = 3). Asterisks indicate significant differences calculated using Tukey’s test (∗∗P < 0.01; ∗P < 0.05).

