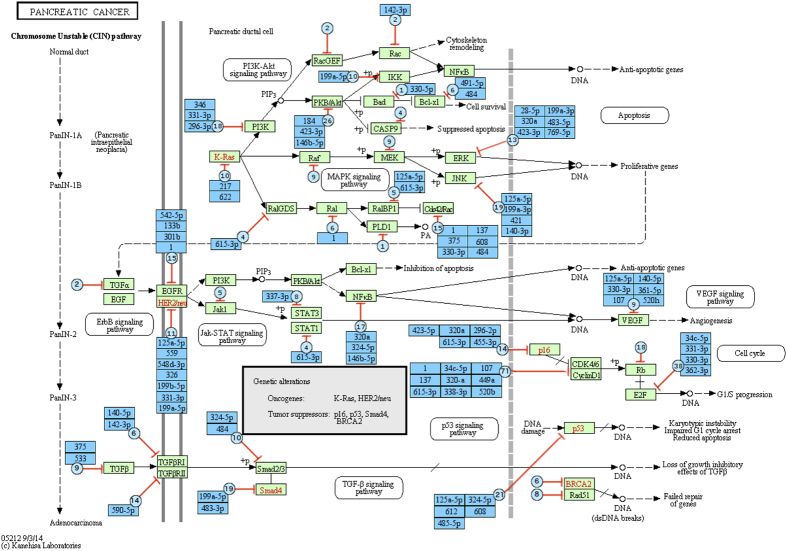
Figure 3. Graphical representation of the augmented pathway Pancreatic cancer.
The green rectangle nodes and black arrows show the KEGG genes and their interactions while the blue nodes and red arrows show the miRNAs and their interactions with the genes. In each miRNA node added, we show the total number of miRNAs (blue circles) that are known to target the gene, and the names of the miRNA (blue rectangles) that were actually measured in the 6 pancreatic miRNA datasets. This is a subset of the total set of miRNAs known to target genes on this pathway.

