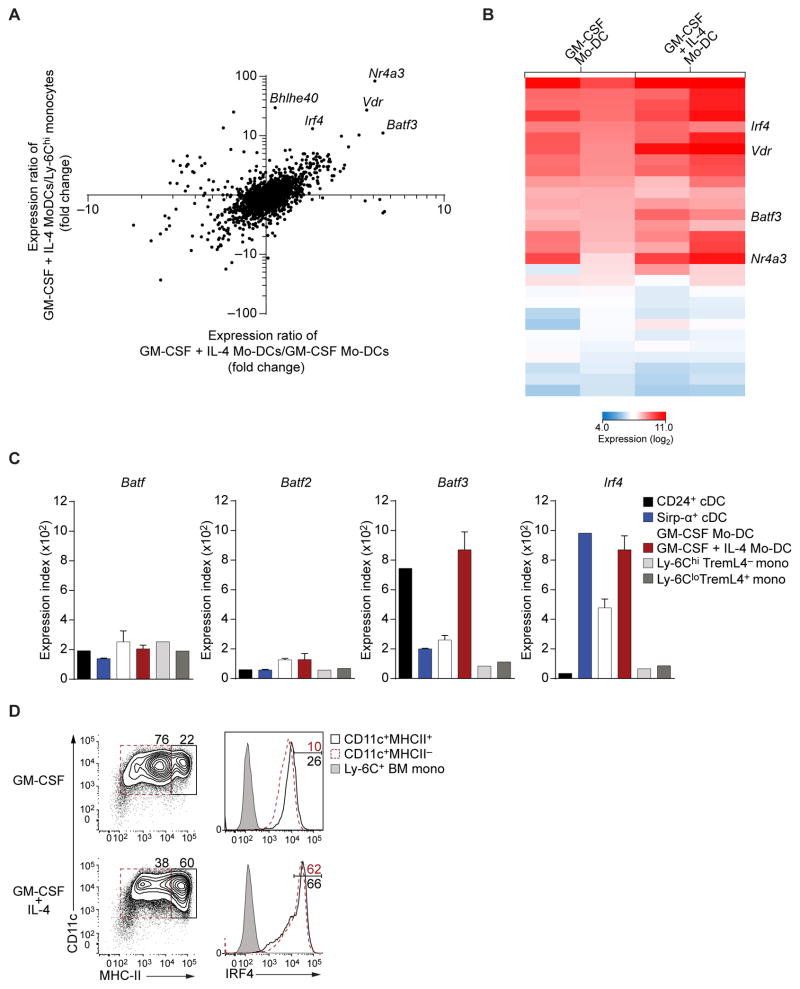
Figure 4. Mo-DCs induce expression of Batf3 and Irf4 in response to IL-4.
(A) Gene expression microarray analysis of Ly-6Chi monocytes and Mo-DCs differentiated with GM-CSF alone or GM-CSF and IL-4. Shown is the ratio of expression in Mo-DCs generated with GM-CSF and IL-4 versus that of Mo-DCs generated with GM-CSF alone (horizontal axis) plotted against the ratio of expression in Mo-DCs generated with GM-CSF and IL-4 versus that in monocytes (vertical axis) for all transcription factor-encoding genes. (B) Gene expression of transcription factors induced at least 2-fold in Mo-DCs cultured with IL-4 relative to Mo-DCs cultured with GM-CSF alone. Shown are biological replicates for each cell lineage. (C) Relative expression of Batf, Batf2, Batf3 and Irf4 from microarrays of the indicated cell type. (D) Representative intracellular flow cytometry analysis of sorted Ly-6ChiTREML4− BM monocytes cultured in GM-CSF with or without IL-4. Ly-6C+ BM monocytes are shown as control. Data is representative of three independent experiments.

