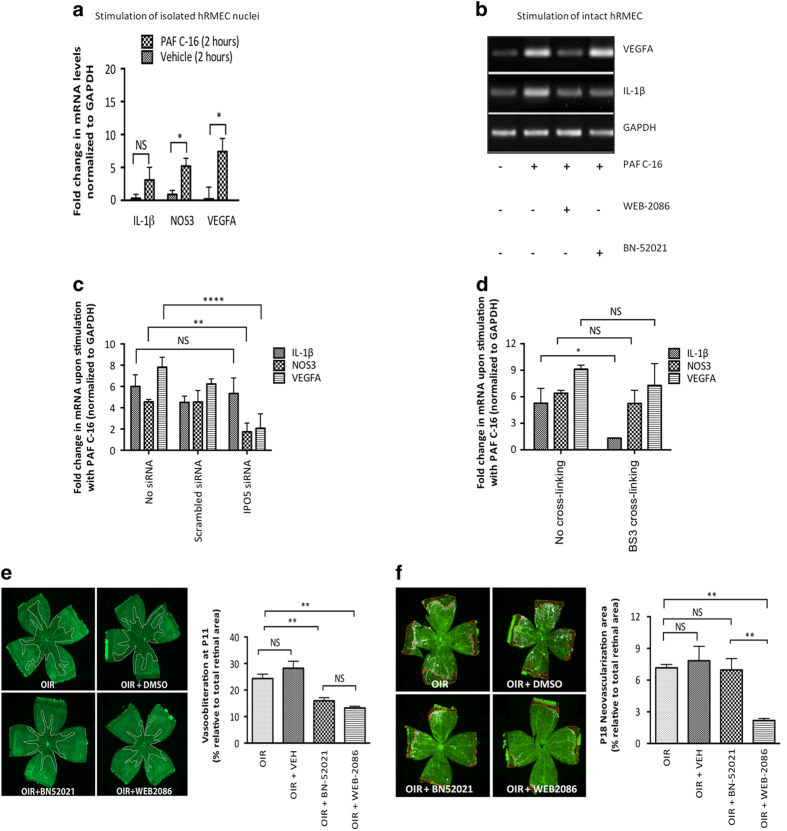
Figure 4.
Nuclear PTAFR has functions distinct from its cell surface counterpart and the former affects retinal neovascularization in OIR. *P<0.05, **P<0.01 and ****P<0.0001. (a) Stimulation of freshly isolated nuclei from hRMECs with PAF C-16 (100 nm for 30 min). PAF C-16 causes significant augmentation of NOS3 (P=0.015) and VEGFA (P=0.019), but not IL1B (P=0.071) levels. All values are represented as mean±s.d. The gene expression was analyzed using four independent replicates. RNA was isolated 120 min after stimulation in all conditions and gene expression was analyzed by qRT-PCR. (b) Stimulation of cultured hRMECs with PAF C-16 (100 nm for 30 min) with or without pre-treatment using indicated PTAFR antagonist for 30 min. The pre-treatment with membrane-permeable antagonist (100 nm WEB-2086) inhibits PAF-induced IL1B and VEGFA expression. The non-permeable antagonist (10 μm BN-52021), on the other hand, only attenuates PAF-induced IL1B, but not VEGFA mRNA levels. RNA was isolated 120 min after stimulation and analyzed by RT-PCR. (c) Effect of IPO5 knockdown on PAF-induced gene expression. IPO5 siRNA treatment significantly reduces PAF-induced augmentation of NOS3 (P=0.004) and VEGFA (P<0.0001) levels, but has no effect on IL1B (P=0.844) levels. (d) Effect of chemical crosslinking on PAF-induced gene expression. The crosslinking prevented upregulation of PAF-induced IL1B (P=0.013), but had no significant difference on NOS3 (P=0.997) and VEGFA (P=0.385) levels. (e) Retinal VO using the hyperoxia model of OIR in rats. The OIR resulted in central retinal VO at P11, as delineated by white margins in lectin-stained retinal flat-mounts (top left panel), and this was prevented by systemic administration of either Ptafr antagonists (five injections from P6 to P10) BN-52021 (P=0.006) and WEB-2086 (P=0.003) (two bottom panels), but not by the vehicle treatment (top right panel) (P=0.458); there was no statistically significant difference between the two antagonists (P>0.999). The Y axis in graph represents % of avascular retina at P11 relative to the total area (n=5–8 retinas per group, NS=not significant). (f) Retinal neovascularization using cycling model of OIR in rats. OIR-induced retinal neovascularization (top left panel) is reduced by the administration of membrane-permeable WEB-2086 (bottom right panel) (P=0.006), but not that of either impermeable BN-52021 (bottom left panel) (P>0.999) or the vehicle (top right panel) (P>0.999). The Y axis in graph represents % of retina with neovascularization (quantified with SWIFT-NV [110]) at P18 relative to the total area (n=5–8 retinas per group, NS, not significant).

