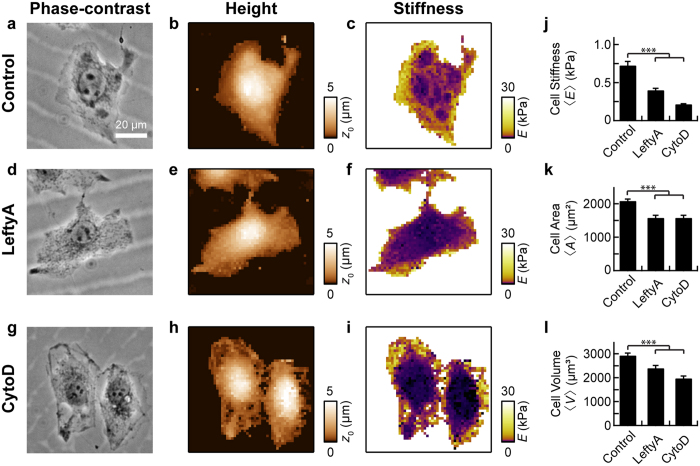
Figure 1. AFM analysis of stiffness and shape of Ishikawa cells with and without LeftyA treatment.
Representative optical phase contrast image (a), AFM contact height image (b) and AFM stiffness image (c) of an untreated human endometrial cancer Ishikawa cell. Representative optical phase contrast image (d), AFM contact height image (e) and AFM stiffness image (f) of an Ishikawa cell treated for 2 hours with 25 ng/ml LeftyA. Representative optical phase contrast image (g), AFM contact height image (h) and AFM stiffness image (i) of an Ishikawa cell 15 min after addition of 10 μM cytochalasin D. Mean cell stiffness 〈E〉 (j), mean cell area 〈A〉 (k) and mean cell volume 〈V〉 (l) of untreated, LeftyA and cytochalasin D treated Ishikawa cells (〈E〉Contr = 0.73 kPa, 〈E〉LeftyA = 0.40 kPa, 〈E〉CytoD = 0.21 kPa, 〈A〉Contr = 2084 μm2, 〈A〉LeftyA = 1579 μm2, 〈A〉CytoD = 1580 μm2, 〈V〉Contr = 2934 μm3, 〈V〉LeftyA = 2403 μm3, 〈V〉CytoD = 1974 μm3). Error bars represent SEM of geometric mean (j) and SEM of arithmetic mean (k,l). *P < 0.05; **P < 0.01; ***P < 0.001 using one-way ANOVA followed by two-tailed Tukey’s test.

