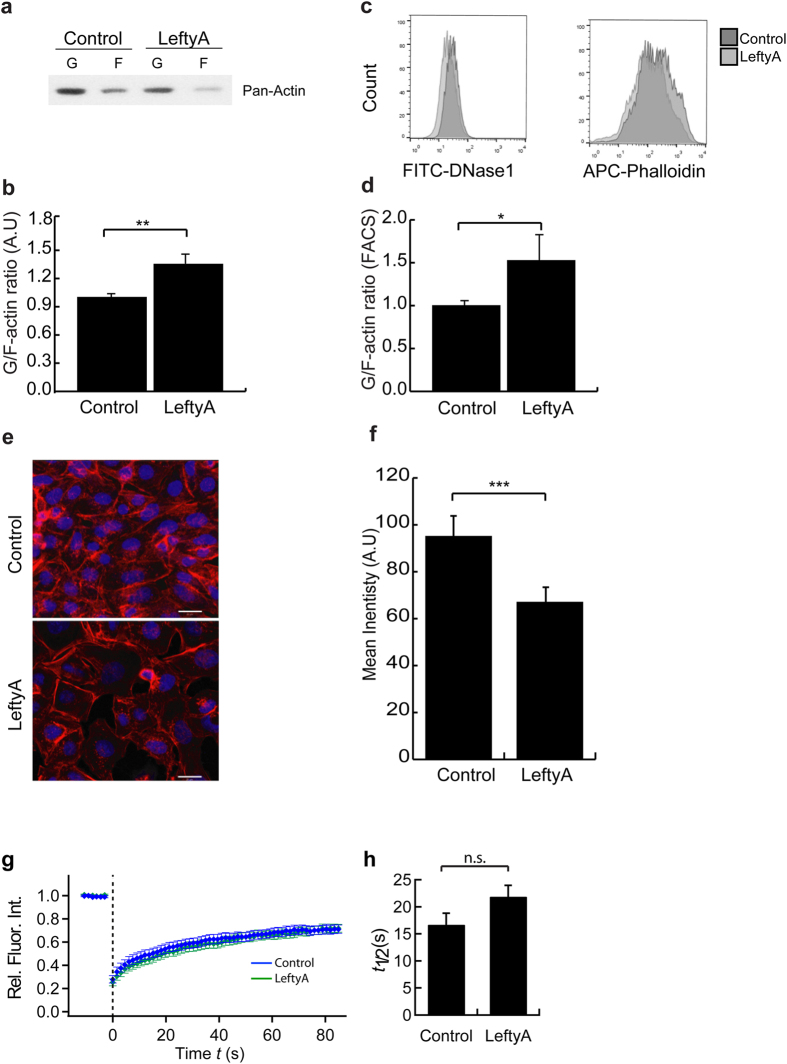
Figure 2. Effect of LeftyA on actin polymerization in Ishikawa cells.
(a) Representative original Western blot of soluble G-actin over F-actin in human endometrial cancer Ishikawa cells after a 2 hour treatment without (−LeftyA) and with (+LeftyA) LeftyA (25 ng/ml). (b) Arithmetic means ± SEM (n = 6; arbitrary units) of soluble G-actin over F-actin ratio in Ishikawa cells after a 2 hour treatment without and with LeftyA (25 ng/ml). (c) Representative original histogram of DNase1 (G-actin; Left) and Phalloidin (F-actin; Right) binding in Ishikawa cells after a 2 hour treatment without (dark grey) and with (grey) LeftyA (25 ng/ml). (d) Arithmetic means ± SEM (n = 6; arbitrary units) of G-actin over F-actin ratio in Ishikawa cells after a 2 hours treatment without and with LeftyA (25 ng/ml). (e) Original confocal images of eflour660-phalloidin binding to F-actin (red) and SYTOX Green for nuclei (blue) in Ishikawa cells treated with or without LeftyA (white bar 20 μm) (f) arithmetic means ± SEM (n = 6) of actin fluorescence in Ishikawa cells with and without LeftyA treatment. (g) Averaged FRAP curve (n = 21) of control cells or cells treated for 2h with LeftyA. Error bars denote SEM of arithmetic mean of normalized fluorescence intensity at each time point. (h) Mean half-time of recovery for LeftyA-treated (Green) and untreated Ishikawa cells (Control; Blue) obtained by FRAP. *P < 0.05; **P < 0.01; ***P < 0.001 using Student’s t-test.

