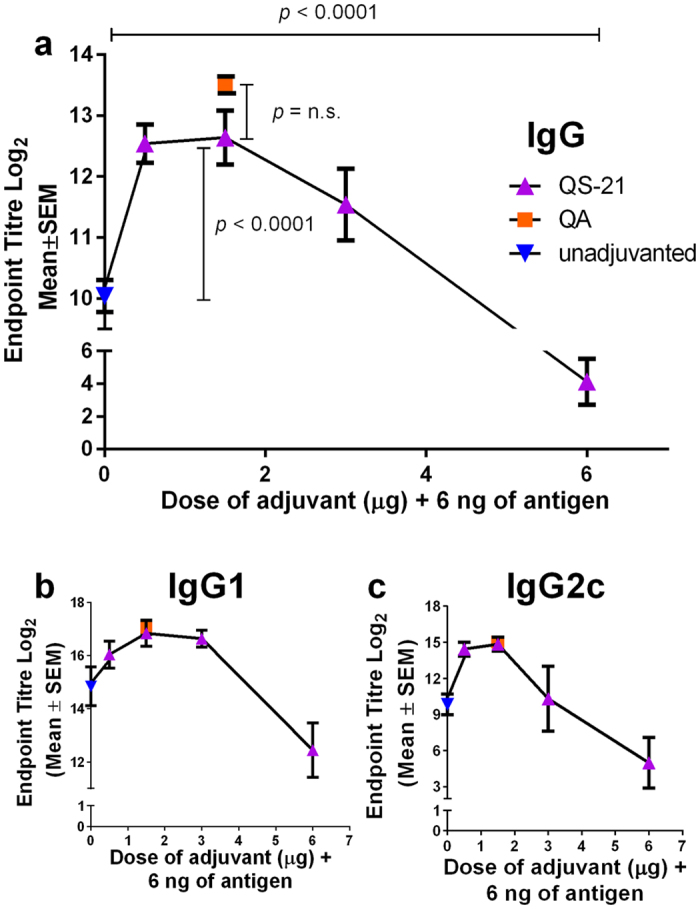
Figure 1. Adjuvant dose curve of antigen specific IgG, IgG1 and IgG2c responses induced by influenza antigen and co-delivery of different dose of QS-21 or 1.5 μg of QA by Nanopatch.

Nanopatch groups were represented by  (unadjuvanted
  , QS-21
  ) and
) and  (QA
(QA  ) (a) Total antigen specific IgG (b) IgG1 and (c) IgG2c induced by co-administering 6 ng of influenza antigen with QS-21 at different doses (0, 0.5, 1.5, 3.0 and 6.0 μg) or 1.5 μg QA delivered by the Nanopatch, 21 days post immunisation. ELISA antibody data represent the Mean ± SEM, statistical significance is when p < 0.05, total antigen specific IgG was performed with two independent sets of n = 5 C57BL/6 mice per group, IgG1 and IgG2c are performed with one set of n = 5 mice per group. Statistical tests between three or more groups were performed with one-way ANOVA and between two groups were performed using Student’s t-test.
