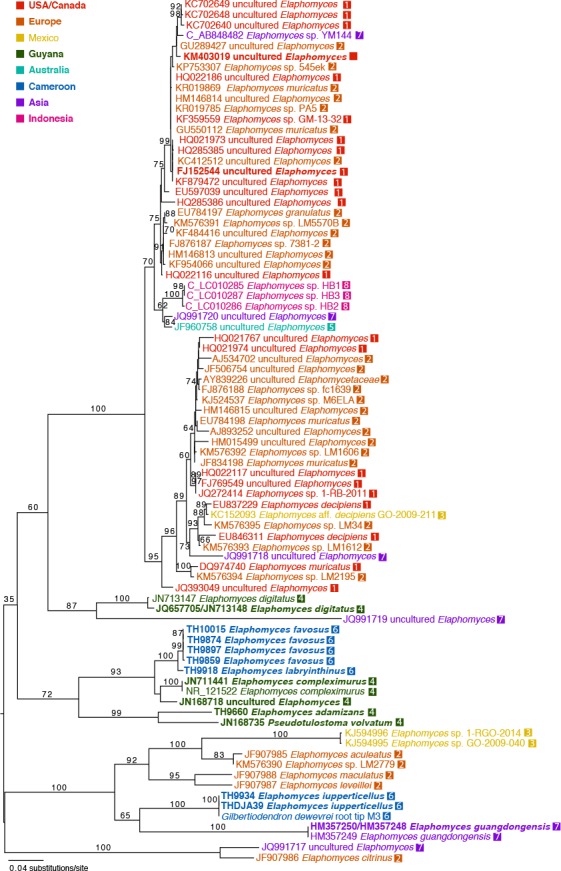
Fig. 1.

Best maximum likelihood phylogram (–ln = 10065.206922) of a combined analysis of ITS and 28S sequences of Elaphomycetaceae taxa in RAxML using a GTRGAMMA substitution model. Tree is midpoint rooted. Numbers on or next to branches are nonparametric bootstrap supports >70 % from 550 bootstrap replicates. For terminals downloaded from GenBank, labels begin with GenBank accession number and are colour-coded by geographic origin of the sources of the sequences as determined by GenBank records. Terminal labels for taxa generated in this study begin with the collection number. Terminals in bold are represented by both ITS and 28S sequences. Those beginning with a ‘C’ had their sequence orientation corrected for phylogenetic analysis.
