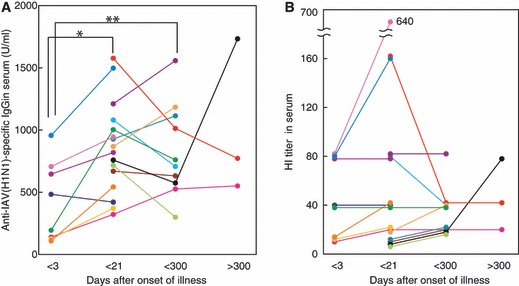
Figure 2.

Kinetics of induction of anti‐IAV(H1N1)‐specific IgG (A) and HI titers (B) in serum after IAV infection examined over a period of about 1 year. Data and lines represent the serial changes in anti‐HA(H1N1)‐specific IgG (U/ml) of individual patients with different color symbols. *P < 0·01, **P < 0·05.
