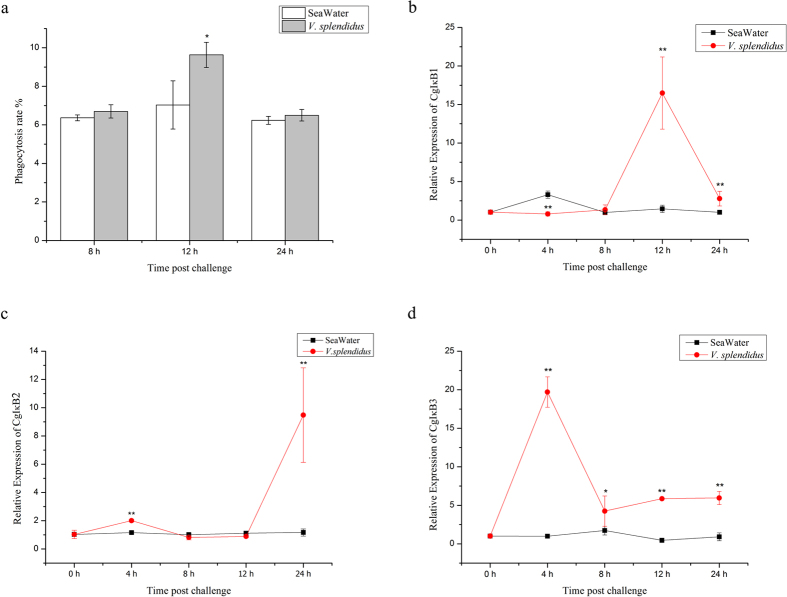
Figure 1. Alternations of haemocyte phagocytosis rate and CgIκBs expression levels during challenge.
The phagocytosis rates of oyster haemocytes at 8 h, 12 h and 24 h after V. splendidus challenge were determined using flow cytometry (a). Expression levels of CgIκB1 (b), CgIκB2 (b) and CgIκB3 (c) during infection were also investigated by qRT-PCR. Significant differences were marked with asterisk “*” if p < 0.05 or “**” if p < 0.01.

