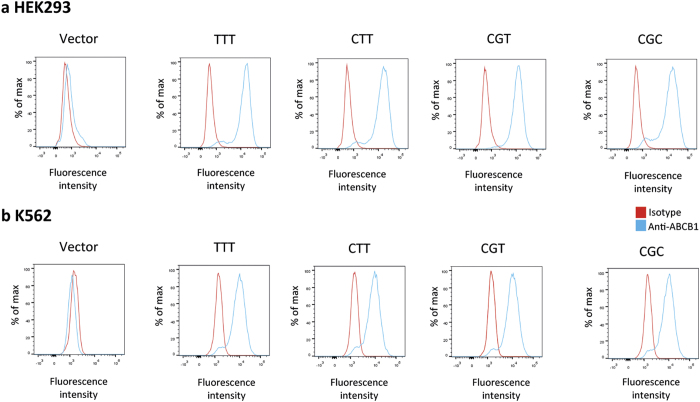
Figure 1. ABCB1 cell surface expression.
Histograms created from a flow cytometry analysis of (a) HEK293 stably transfected with the empty pcDNA3.1 (vector) and HEK293 cells transfected with ABCB1T-T-T, ABCB1C-T-T, ABCB1C-G-T and ABCB1C-G-C (median fluorescence intensity, arbitrary units (AI): 15384, 12381, 16290 and 16521, respectively) and (b) K562 cells stably transfected with the empty pEF (vector), and with K562 cells transfected with ABCB1T-T-T, ABCB1C-T-T, ABCB1C-G-T and ABCB1C-G-C (median fluorescence: 10271, 9577, 8993 and 9577, respectively). Cells were incubated with an FITC-conjugated anti-ABCB1 antibody (blue line) or a matched isotypic control (red line).

