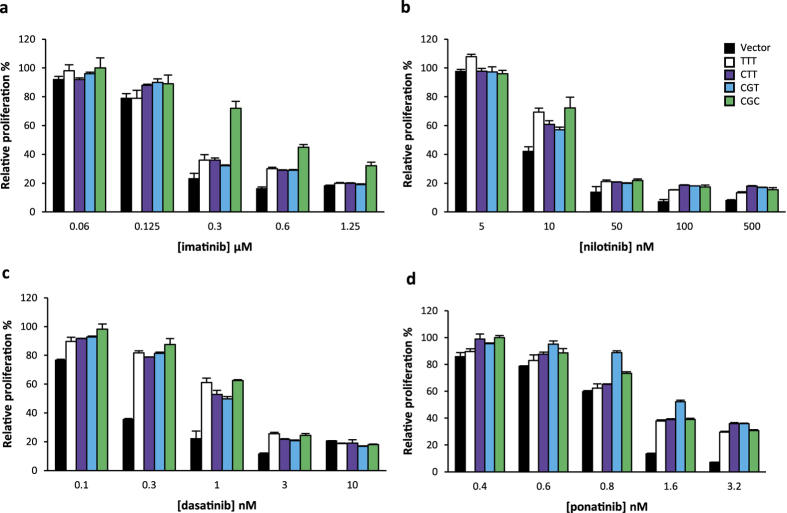
Figure 5. Impact of ABCB1 1236C > T-2677G > T-3435C > T polymorphisms on anti-proliferative effects of TKIs.
K562 cell proliferation after treatment with different concentrations of (a) imatinib, (b) nilotinib, (c) dasatinib or (d) ponatinib for 24h (N ≥ 3). The relative proliferation of treated cells compared to control cells is shown. IC50 (nM) are shown in Table 1.

