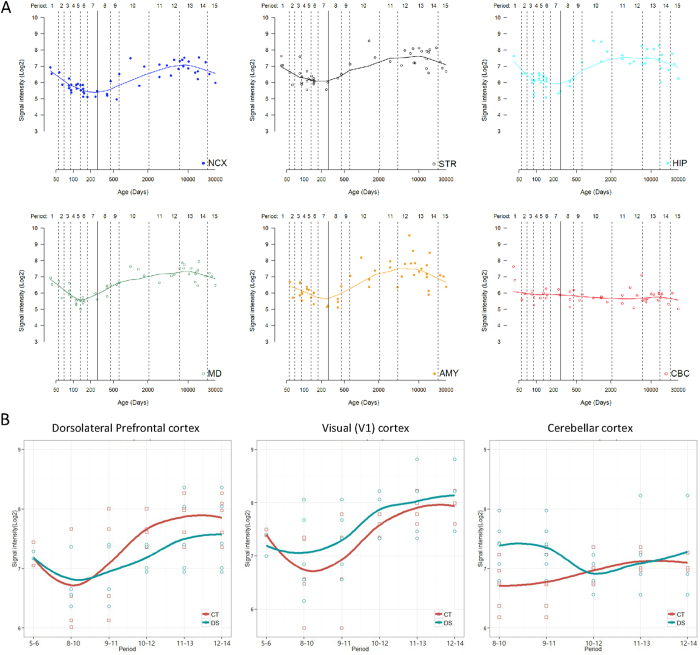
Figure 3. Dynamic expression of EURL/C21ORF91 in the human brain.
(A) Temporal analysis of EURL/C21ORF91 mRNA in the human brain reveals a dynamic expression pattern within the neocortex (NCX), striatum (STR), hippocampus (HIP), mediodorsal nucleus of the thalamus (MD), amygdala (AMY); while expression levels within the cerebellar cortex (CBC) are relatively stable throughout all ages tested. The solid line represents birth (defined as 280 days). The line for each region represent media values, and are generated by LOESS regression method using “ggplot2” package, as previously described45. (B) Analysis of EURL/C21ORF91 mRNA expression in the dorsolateral prefrontal cortex (DFC), primary visual cortex (V1C) and cerebellar cortex (CBC) reveals different levels of gene expression between Down Syndrome (DS, in green) patients and age-matched controls (CT, in red). One-tailed t-tests were applied to gene expression datasets for DFC, V1C and CBC to investigate potential differences in gene expression levels, as described. To account for the variabilities in tissues collected for gene expression studies, a “sliding window” approach was adopted in which mRNA signals from closely matched ages of tissue samples were grouped (see Methods for further details). Age ranges for Periods 5..6 (postconception week 14pwc, 15pcw, 16pcw, 17pcw), 8..10 (1 month old (mo), 4mo, 6mo, 9mo, 10mo, 1 year (yr), 2yr, 3yr), 9..11 (6mo, 9mo, 10mo, 1yr, 2yr, 3yr, 8yr, 10yr), 10..12 (2yr, 3yr, 8yr, 10yr, 13yr, 15yr, 18yr, 19yr), 11..13 (10yr, 13yr, 15yr, 18yr, 19yr, 22yr, 37yr, 39yr), 12..14 (13yr, 15yr, 18yr, 19yr, 22yr, 37yr, 39yr, 40yr, 42yr).

