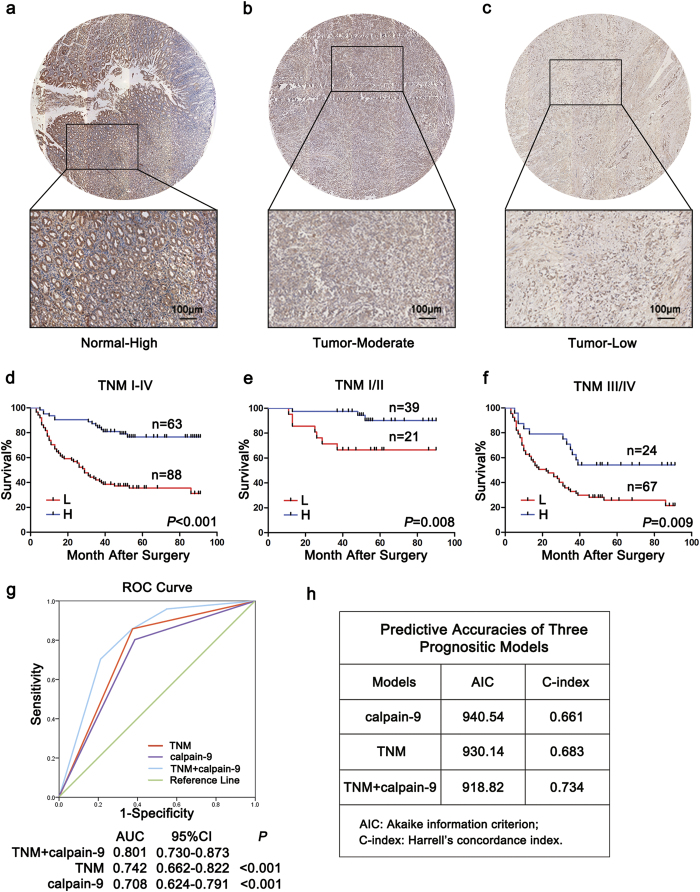
Figure 4. The predictive value of calpain-9 expression in patients with gastric cancer.
(a–c) Representative images of tissue microarray stained for calpain-9 and its regional magnification in gastric cancer sections and adjacent normal sections. Adjacent normal sections showed high calpain-9 expression (a) while gastric cancer tissues showed moderate to low calpain-9 expression (b,c). Bar: 100 μm. (d–f) Kaplan-Meier survival analysis showing the relationship between calpain-9 expression and overall survival in all patients (d) patients at TNM I-II stage (e) and patients at TNM III-IV stage (f). (g) Receiver operating characteristic curve analysis of the sensitivity and specificity of the predictive value of the TNM stage model, calpain-9 model and combined TNM stage and calpain-9 stratification model. (h) The Akaike information criterion (AIC) and Harrell’s concordance index (C-index) analysis of the comparison of the predictive accuracies of TNM staging and calpain-9 expression.

