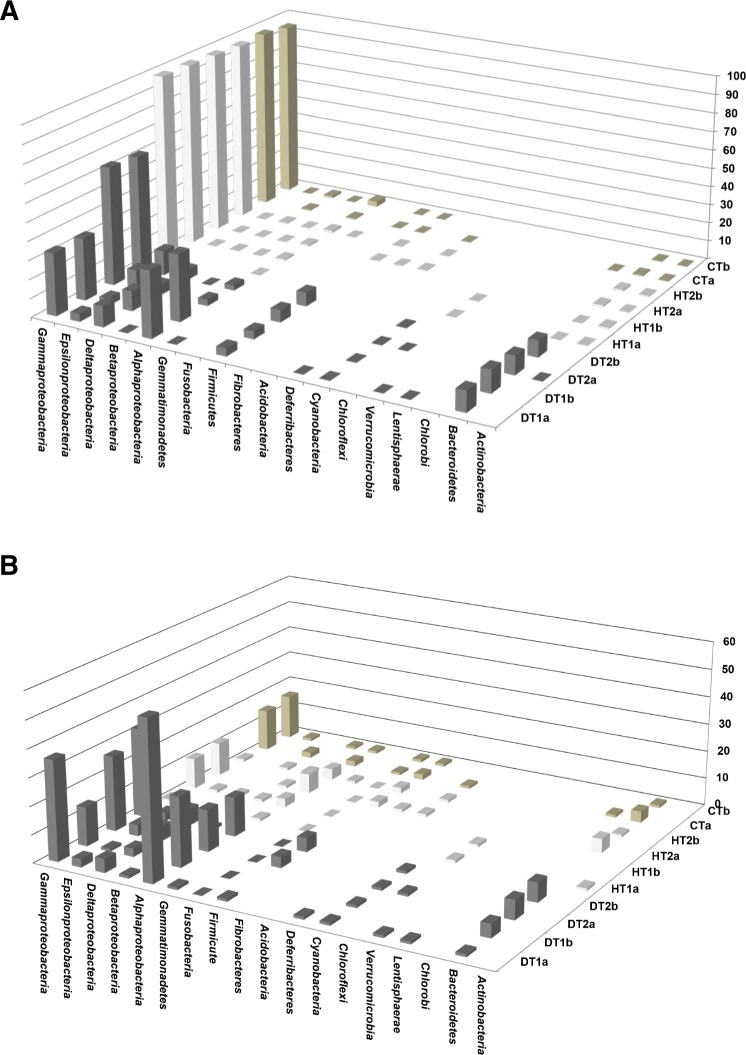
Figure 6. Comparative analysis of bacterial communities associated with three tissue categories of Porites lutea.
(A) Cluster diagram and (B) rarefaction curves of bacterial communities associated with HT 1–2, healthy tissue, CT, control tissue and DT 1–2, diseased tissue of Porites lutea, created using MEGAN software version 5.0.78 beta. Numerals a and b distinguish the duplicate samples.

