Figure 8.

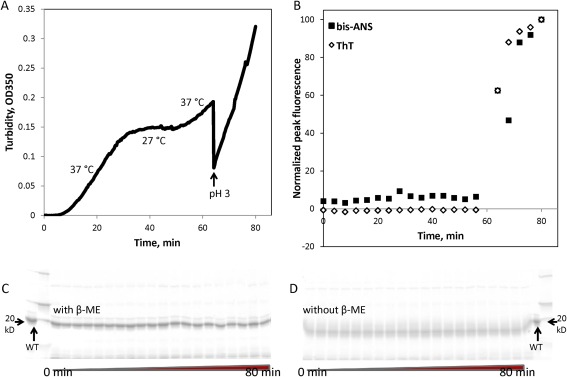
Characterization of heat‐induced W130E aggregates. In samples taken from the aggregation timecourse as measured by turbidity (A), staining with thioflavin T and bis‐ANS (B) was used to measure amyloid formation and exposure of hydrophobic residues, respectively. SDS‐PAGE analysis in the presence (C) or absence (D) of reducing agent (β‐mercaptoethanol) did not reveal any covalently linked oligomers. Minor bands that may be backbone cleavage products were observed, but their intensity did not vary during the course of aggregation.
