
FIGURE 2.
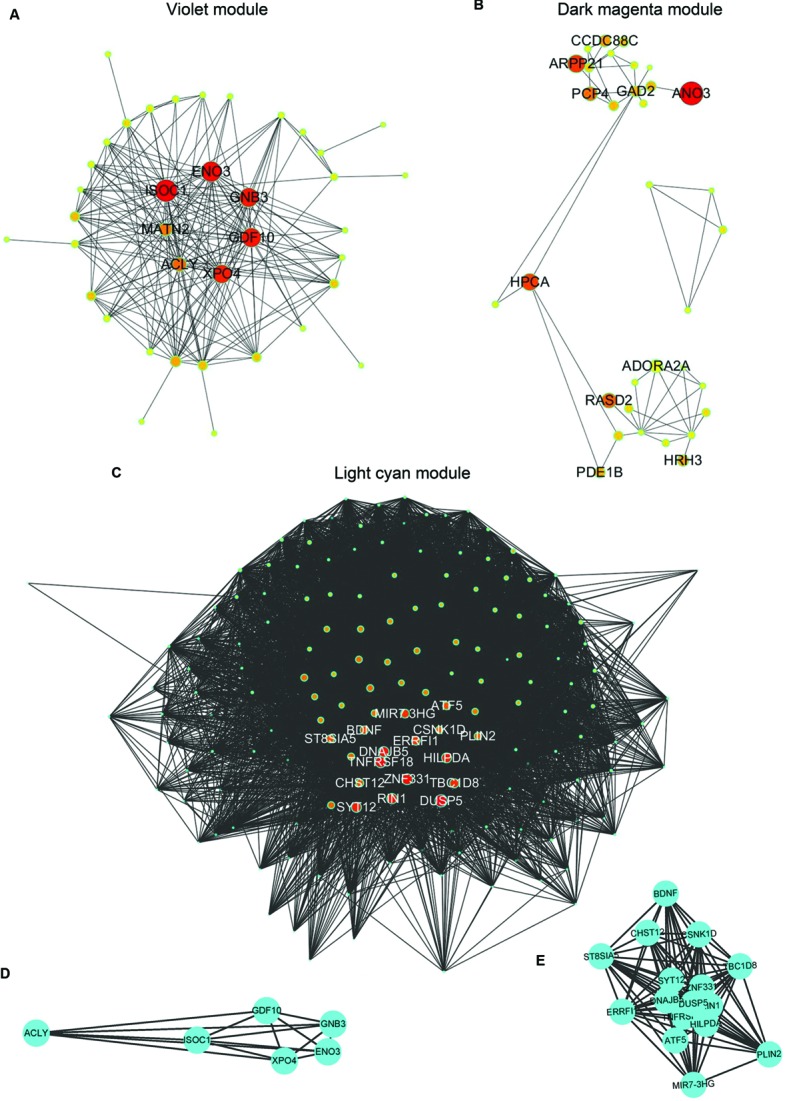
Graphic visualization of modules and complete graphs identified in AD APOE ε4 carriers and non-carriers. (A–C) Graphic visualization of the violet (A), and dark magenta (B) modules for AD APOE ε4 carriers and the light cyan module (C) for AD APOE ε4 non-carriers with hub genes. Nodes were filled with different intermediate colors varying from red to ivory white, where red represents high intramodular connectivity and ivory white represents low connectivity. Edges were weighted by the strengths of the connections between two nodes, for which shorter edges correspond to stronger relationships and vice versa. (D) Complete graph of the top six hub genes in the violet module of AD APOE ε4 carriers. (E) Complete graph of the top sixteen hub genes in the light cyan module of AD APOE ε4 non-carriers.