
FIGURE 3.
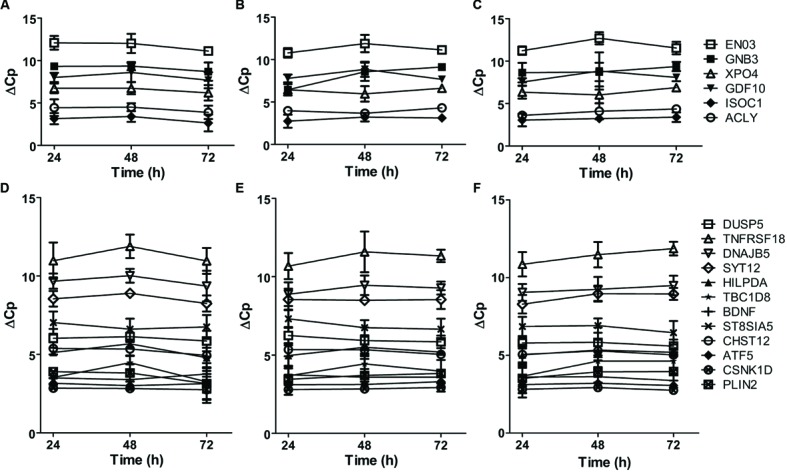
Time-dependent mRNA expression of genes within the complete graphs of the violet and light cyan modules. (A–C) The mRNA expression of six genes within the complete graph of the violet module of AD APOE ε4 carriers. The legends of the six genes are shown on the right. (D–F) The mRNA expression of twelve genes within the complete graph of the light cyan module of AD APOE ε4 non-carriers. The legends of the 12 genes are shown on the right. The primary cultured neurons were treated with recombinant human APOE ε4 (A,D) or ε3 (B,E) at the concentrations of 5 μg/ml or without APOE treatment (C,F) on DIV19 and collected for quantitative RT-PCR after 24, 48, and 72 h of treatment. The relative mRNA levels were calculated by a comparative Cp value. The data are presented as the mean ± SD from at least three independent experiments.