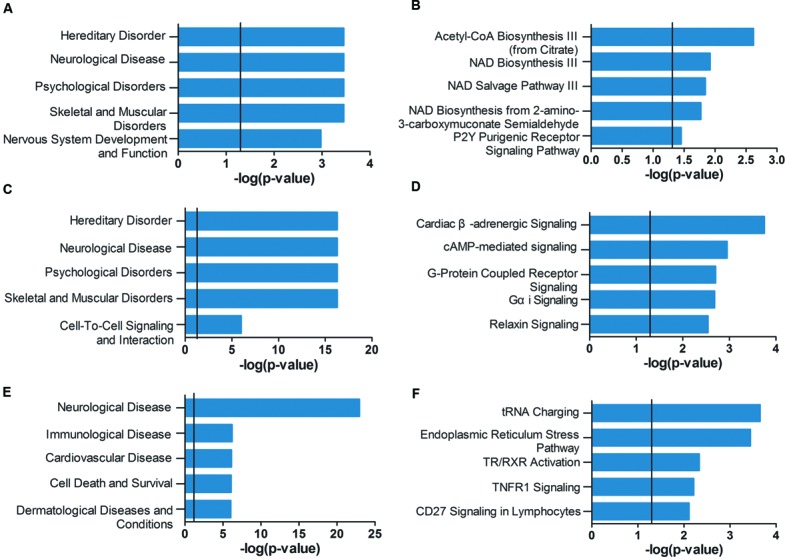
FIGURE 4.

Ingenuity pathway analysis (IPA) gene set enrichment analysis of the modules identified in AD APOE ε4 carriers and non-carriers. IPA-identified top five diseases and functions (A,C,E) and top five canonical pathways (B,D,F) of the violet (A,B) and dark magenta (C,D) modules of AD APOE ε4 carriers and of the light cyan module (E,F) of AD APOE ε4 non-carriers. The verticals indicate the significant thresholds set by IPA.
