
FIGURE 5.
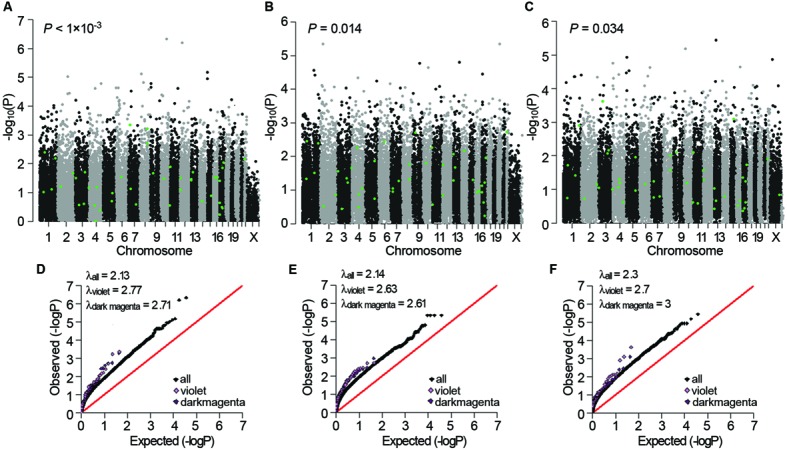
Genetic association signals for the violet and dark magenta modules of AD APOE ε4 carriers. (A–C) Manhattan plots of the enrichment analyses of the genetic association signals from the Myers GWAS (A), GenADA GWAS (B), and ADNI GWAS (C) datasets for the violet module of AD APOE ε4 carriers. The green dots represent genes within the violet module. (D–F) Comparative QQ plots of the genetic association signals from the Myers GWAS (D), GenADA GWAS (E) and ADNI GWAS (F) datasets for the violet and dark magenta module of AD APOE ε4 carriers. The black dots represent all genes, the violet dots represent genes within the violet module and the dark magenta dots represent genes within the dark magenta module. Values of the genomic dispersion factor λ are given in the top-left of each comparative QQ plot.