FIGURE 7.

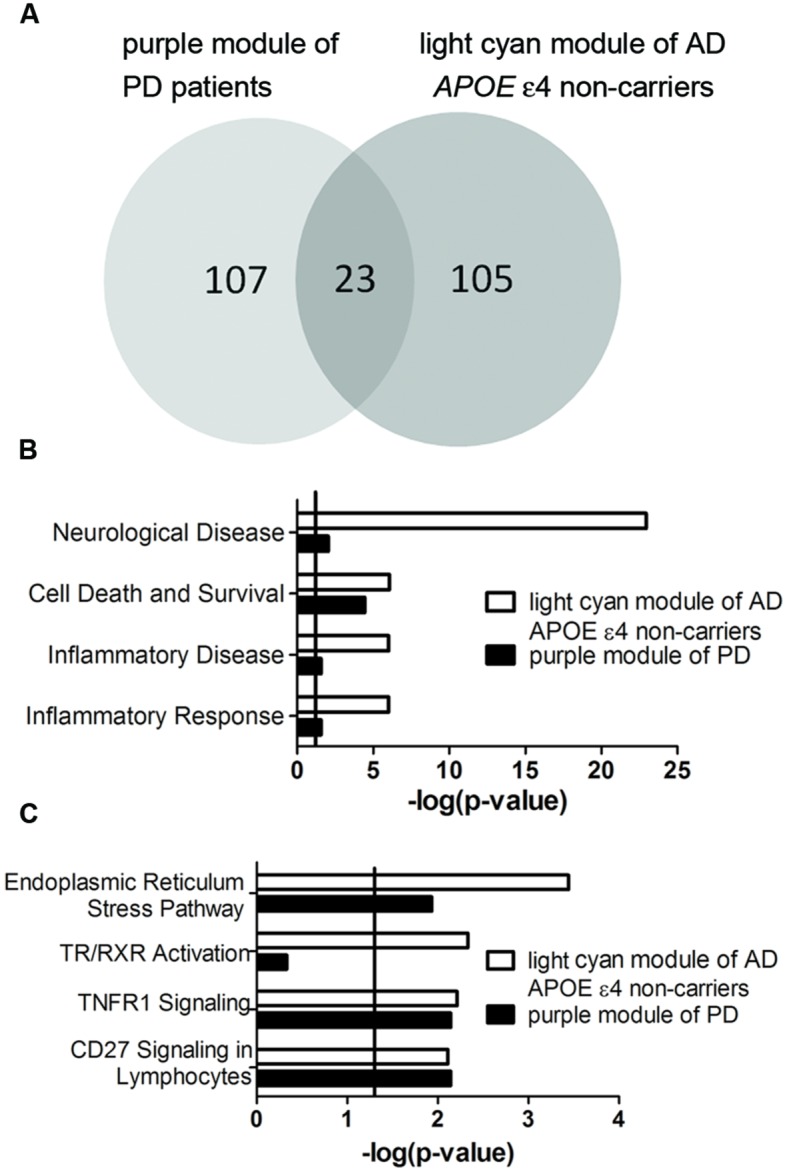
Correlation between purple module of PD patients and light cyan module of AD APOE ε4 non-carriers. (A) The overlapped gene numbers between these two modules shown in a venn diagram. (B,C) The top-shared diseases and functions (B) and canonical pathways (C) between the two modules. The verticals indicate the significant thresholds set by IPA.
