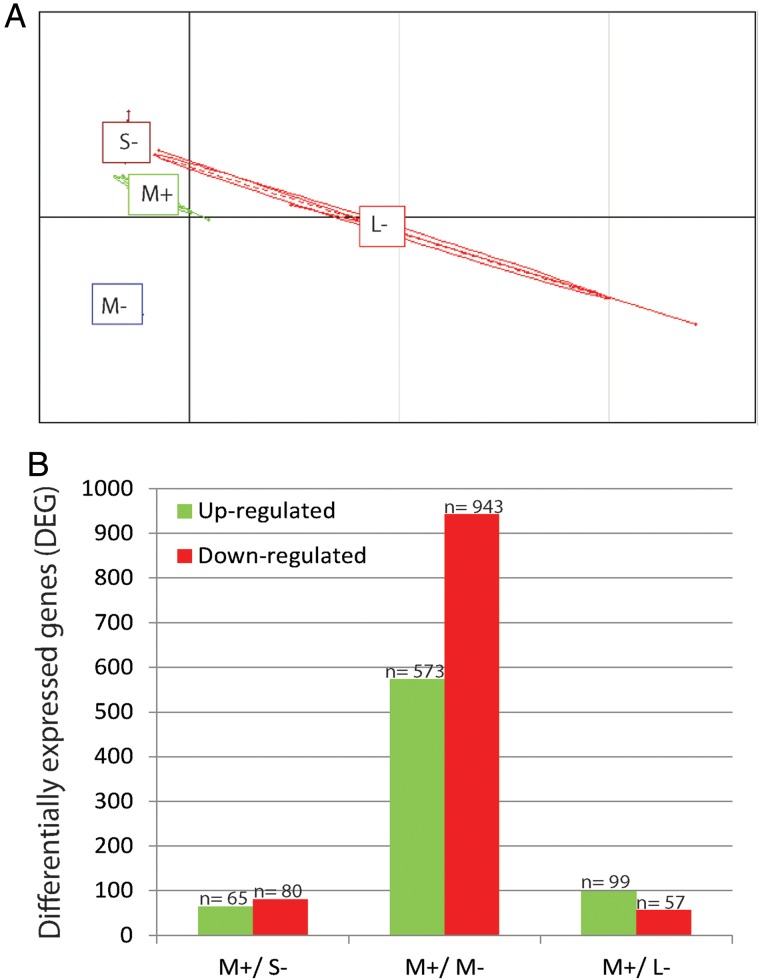
Figure 2.
Characterization of the three different sizes of follicle by microarrays. (A) Principal component analysis of follicle group comparisons using biological triplicate microarray data. (B) Changes in gene expression profile among the different follicular sizes. Unigenes up-regulated (green) and down-regulated (red) between the different microarrays. M+, medium follicles associated with transferable (transferred or cryopreserved) embryos; S− small, M− medium and L− large follicles linked to a poor or blocked embryo development.

