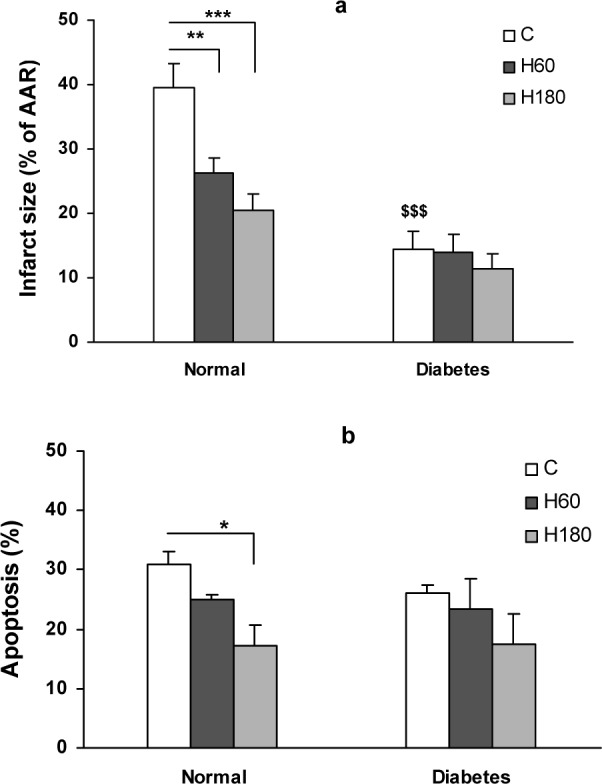
Figure 1. Figure1: (a) Infarct size expressed as percentage of area at risk (AAR) in normal and diabetic rat hearts after 30 min ischemia and 120 min of reperfusion. (b) Percentage of TUNEL positive nuclei in AAR of left ventricle in non-diabetic and diabetic rat hearts. Data presented as mean ± SEM. *p<0.05, **p<0.01 and *** p<0.001 compared to respective control group. $$$ p<0.001, diabetic control vs. normal control group.

