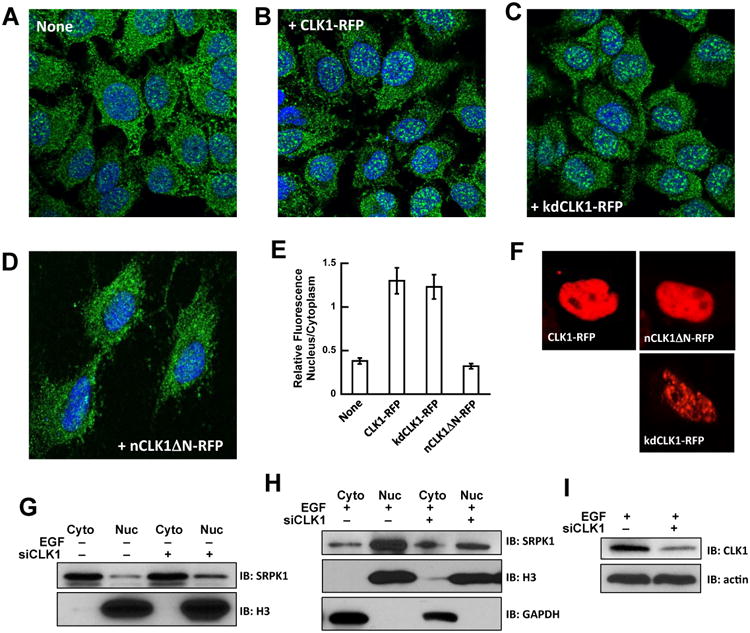
Figure 3. CLK1 expression and SRPK1 subcellular localization.

A-D) Confocal imaging of endogenous SRPK1 (green) in HeLa cells transfected with mock (A), CLK1-RFP (B), kdCLK1-RFP (C) and nCLK1ΔN-RFP (D). Nuclei are stained with DAPI (blue). E) Relative amounts of nuclear and cytoplasmic SRPK1 with and without CLK1 expression. Fractional amounts are calculated using ImageJ. The data represent an average of n=3 and error bars indicate ± SD. F) Confocal imaging of CLK1-RFP, kdCLK1-RFP and nCLK1ΔN-RFP showing nuclear localization. G,H) Nuclear and cytoplasmic SRPK1 levels in HeLa cells treated with CLK1 siRNA in the absence (G) and presence (H) of EGF stimulation. I) CLK1 levels in HeLa cells treated with CLK1 siRNA.
