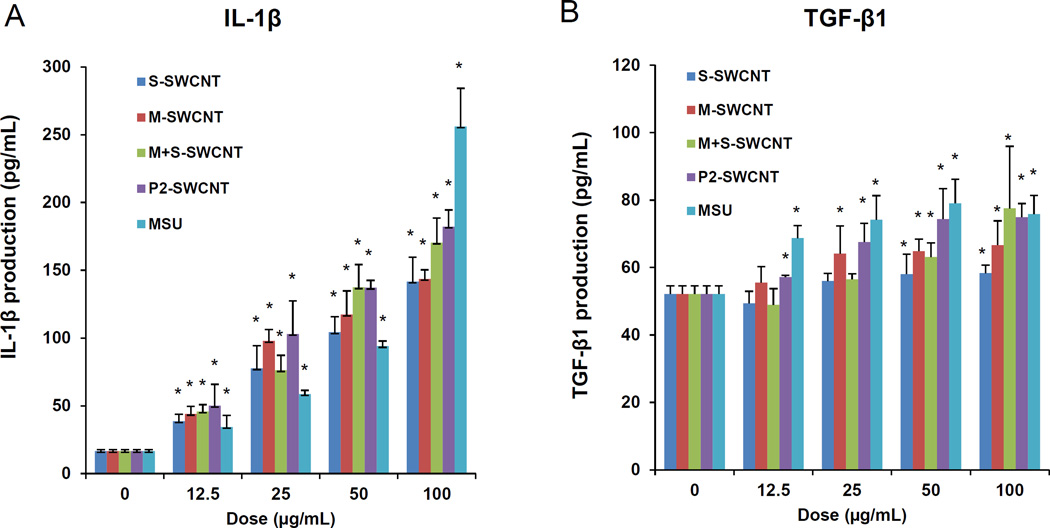
Figure 3. Comparative pro-fibrogenic effects, as reflected by IL-1β and TGF-β1 production in THP-1 and BEAS-2B cells.
Cells were exposed to the indicated concentrations of the sorted SWCNTs for 24 h. IL-1β (A) and TGF-β1 (B) levels were determined on the culture supernatants by ELISA. *p< 0.05 compared to control.

