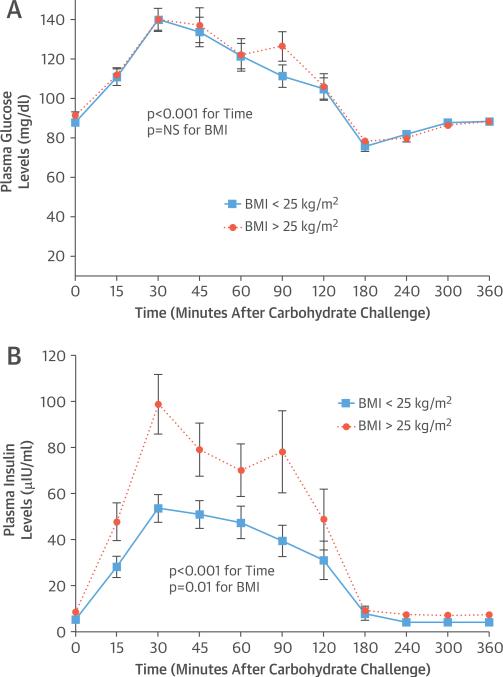
FIGURE 1. Carbohydrate Challenge: Plasma Glucose and Insulin Levels.
Plasma glucose (A) and insulin (B) levels are shown at baseline and in response to the carbohydrate challenge in lean (n = 19) (solid lines with squares) and overweight or obese (n = 14) (dotted lines with circles) individuals. Data are expressed as mean ± SEM.
BMI = body mass index.

