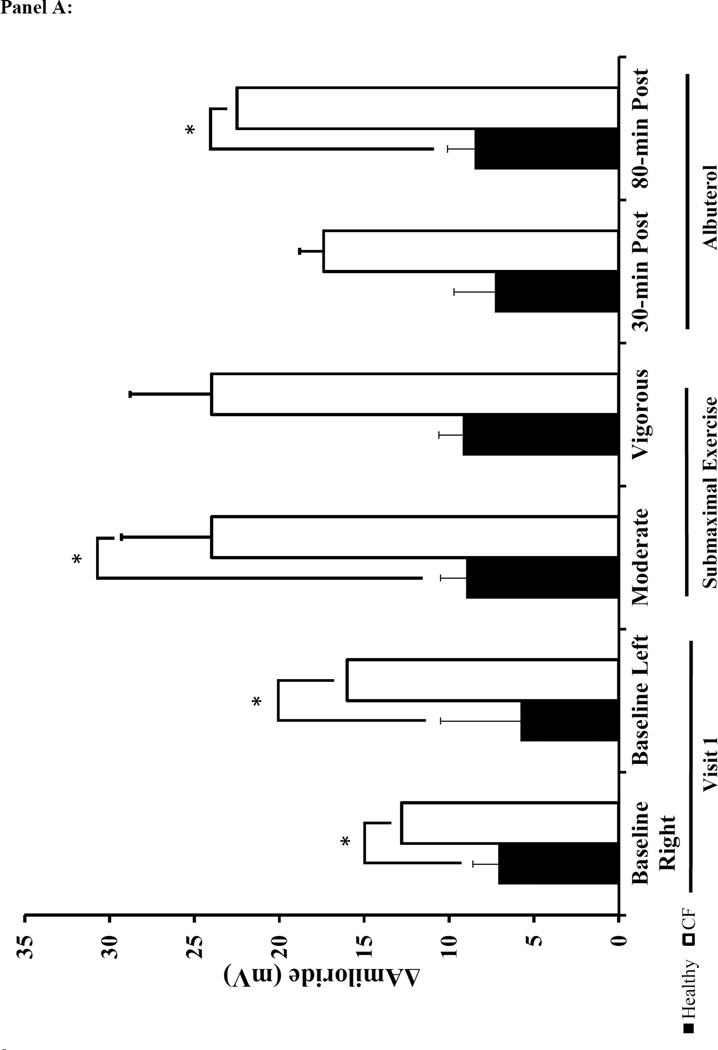
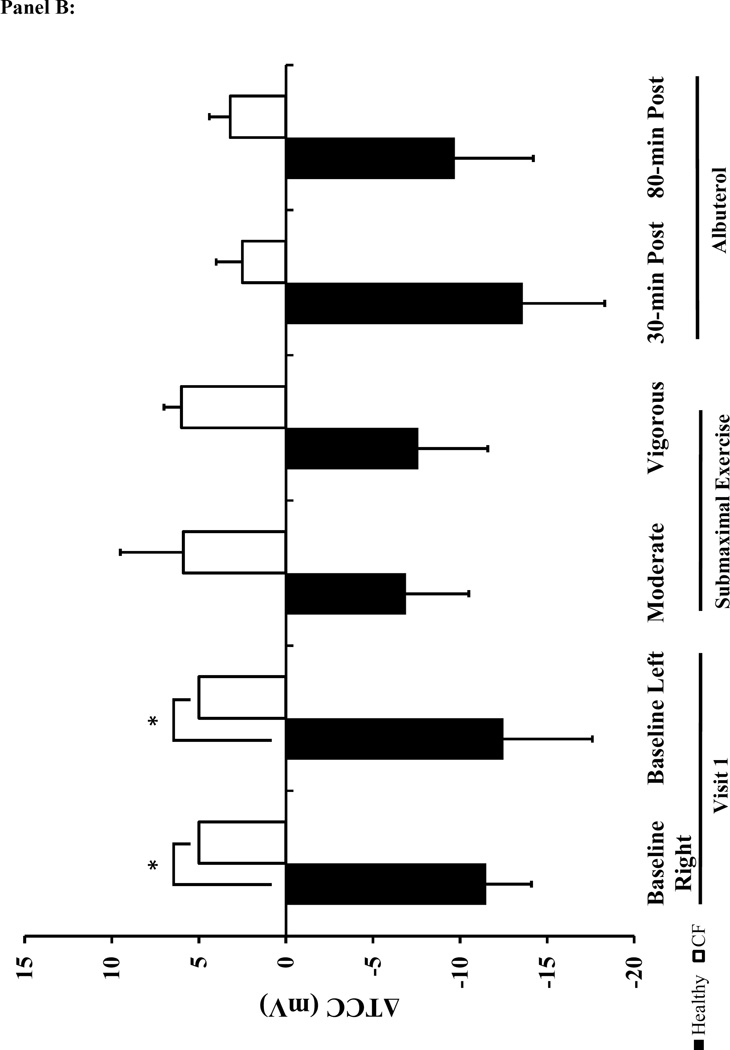
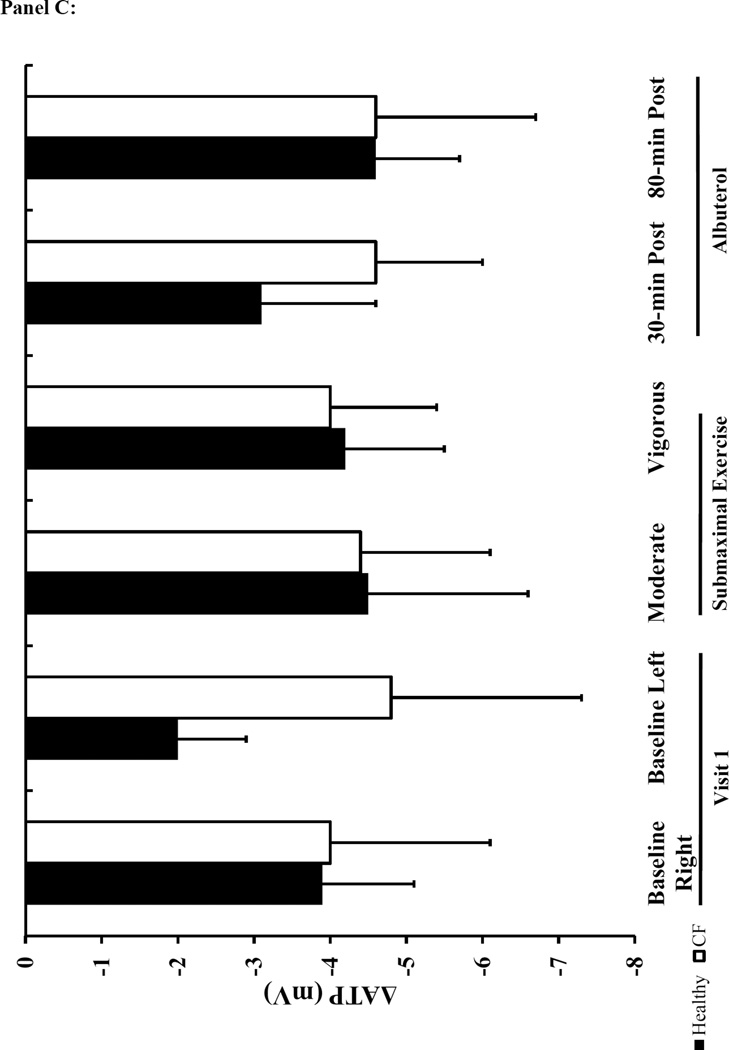
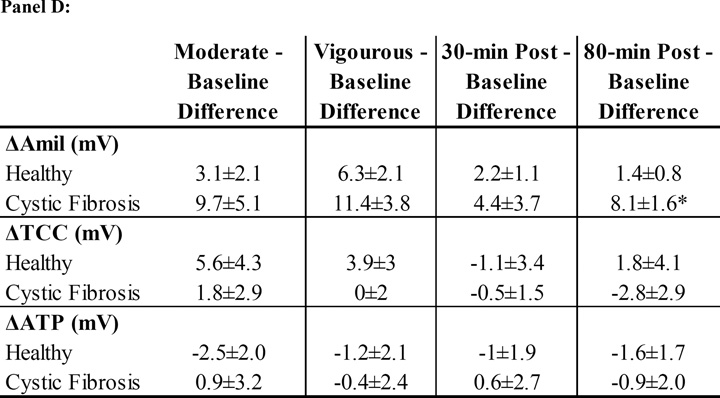
Figure 4. NPD Measured Changes in Na+ and Cl− in Response to Submaximal Exercise and Albuterol.
Panel A: ΔAmil=change with amiloride (measure of changes in Na+ flux). Panel B: ΔTCC=total Cl− conductance. Panel C: ΔATP=change with ATP. The black bars represent healthy subjects and the white bars represent cystic fibrosis subjects. Panel D: The table lists the mean difference in NPD response between the baseline tracing and the tracings performed on the two treatment visits (treatment-baseline). The most responsive nostril served to compare the difference in NPD response between baseline to vigorous and baseline to 80-min post albuterol. The other nostril served to compare the difference between baseline to moderate and baseline to 30-minutes post albuterol. Data presented at mean±SEM. *p<0.025 vs. healthy † p<0.025 vs. moderate intensity


