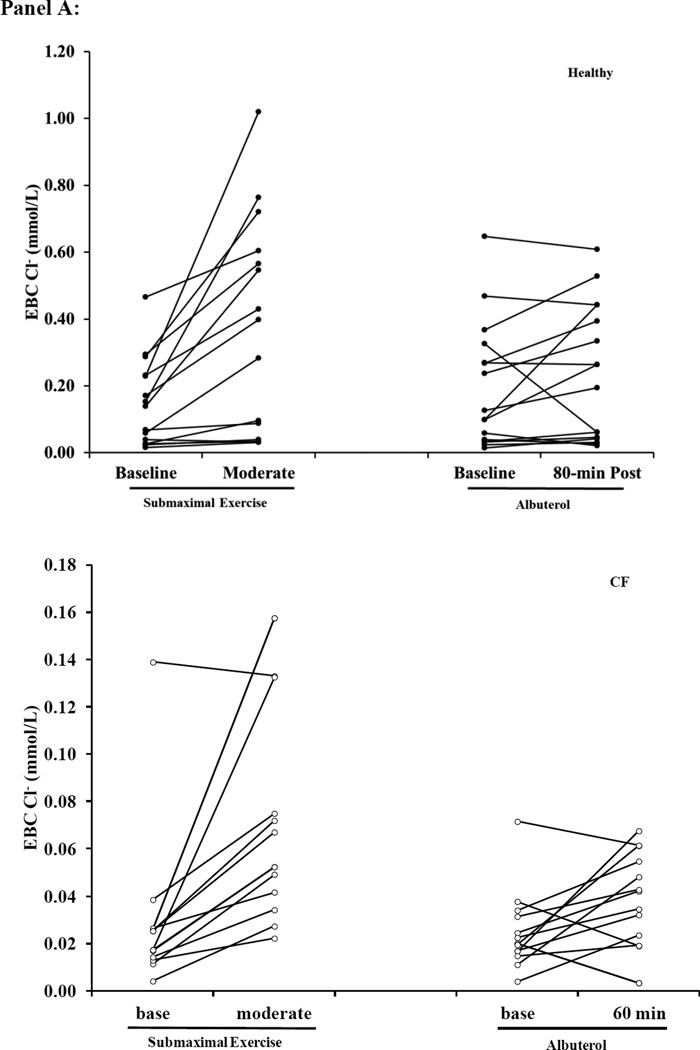
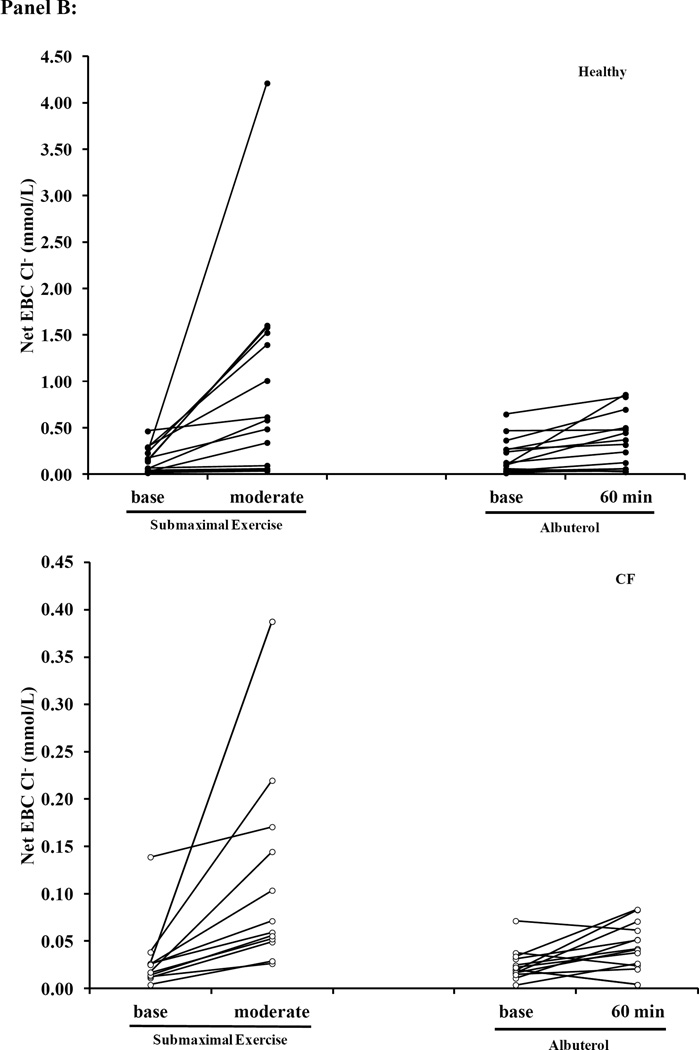
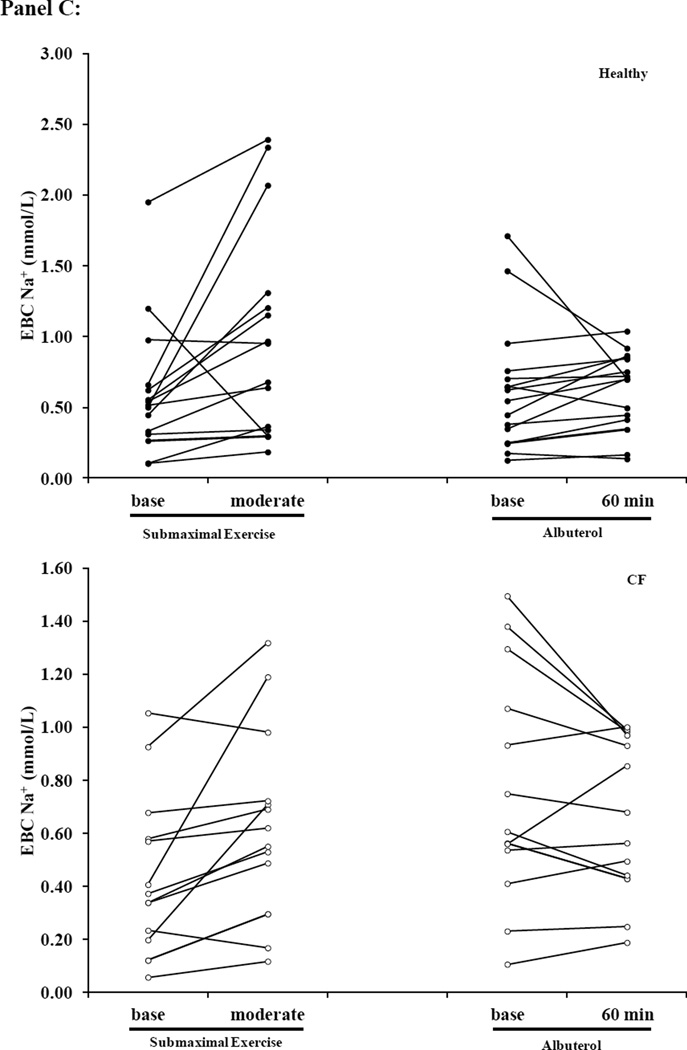
Figure 5. Scatter plots of EBC Na+, Cl− and Net Cl− during Submaximal and Albuterol Visits.
Panel A: EBC Cl− (Top: Healthy Bottom: Cystic Fibrosis (CF)) Panel B: Net EBC Cl− (Top: Healthy; Bottom: CF) Panel C: EBC Na+ (Top: Healthy; Bottom: CF). Healthy subjects are represented by the black circles and the open circles represent CF subjects. The y-axis scaling is different between the two groups, so that the individual changes for subjects within each condition can be appreciated, and due to the difference in Cl− secretion levels between healthy and CF subjects we have kept the scale specific to each condition.


