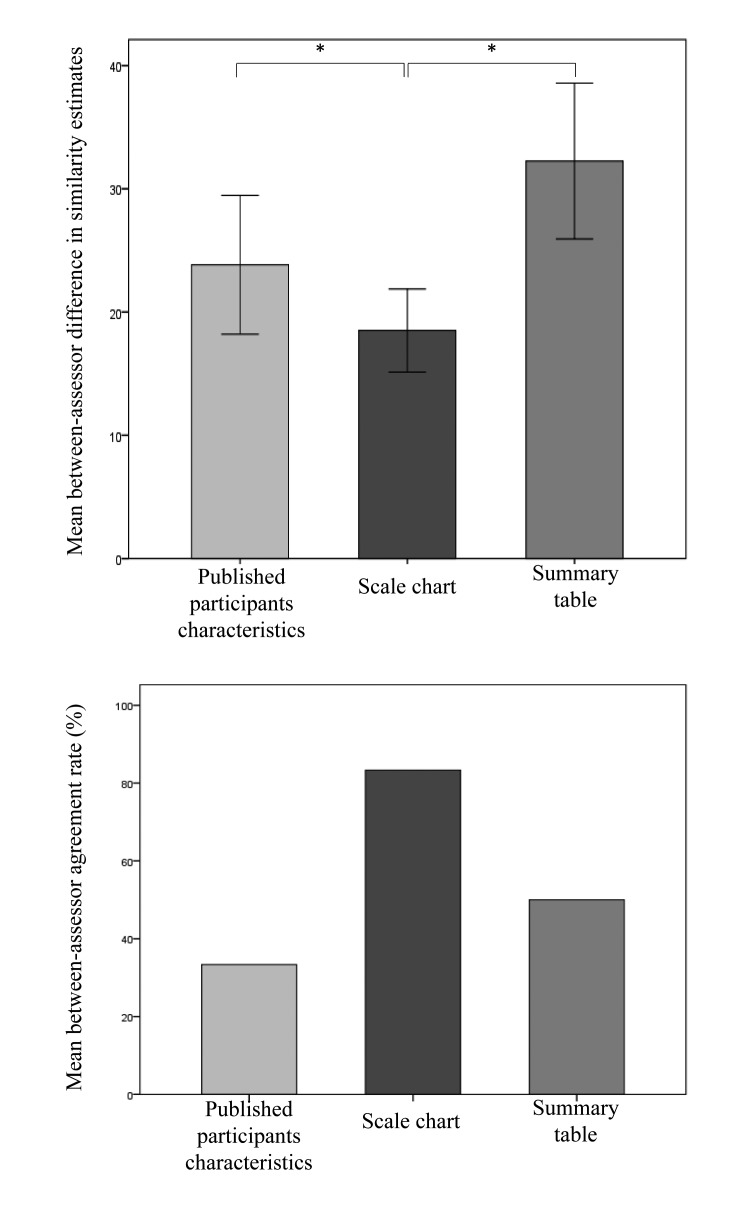
Fig. 2:
Numerical similarity-degree assessment-difference between each two clinicians assessing the same case vignette using the same assessment tool. Error bars represent ± 1 standard error of mean (upper panel); Overall degree of between-assessor agreement on the more similar trial of each pair of trials presented using the same assessment tool (lower panel).

