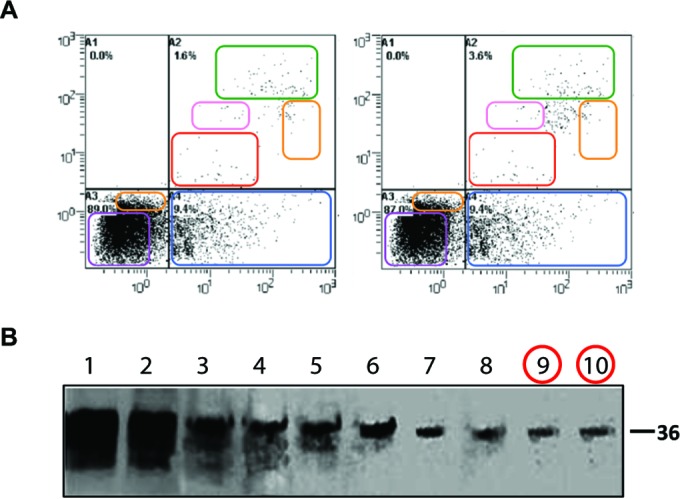
FIG 4 .

Examples of duplication with alteration (category III). (A) The left and right FACS panels represent different experimental conditions and show different percentages of cell subsets, but regions of identity (colored boxes) between the panels suggest that the images have been altered. (This illustration originally appeared in reference 35; the article was retracted in reference 36.) (Reproduced with permission from the publisher.) (B) The figure shown here displays Western blotting results for 10 different protein fractions isolated from a density gradient. The figure appears to show a single blot, but the last two lanes (red circles) appear to contain an identical band. Exposure was altered to bring out details in reference 37; the figure was corrected in reference 38. (Figure reproduced under the Creative Commons [CC BY] license.)
